EasyPost shipping API
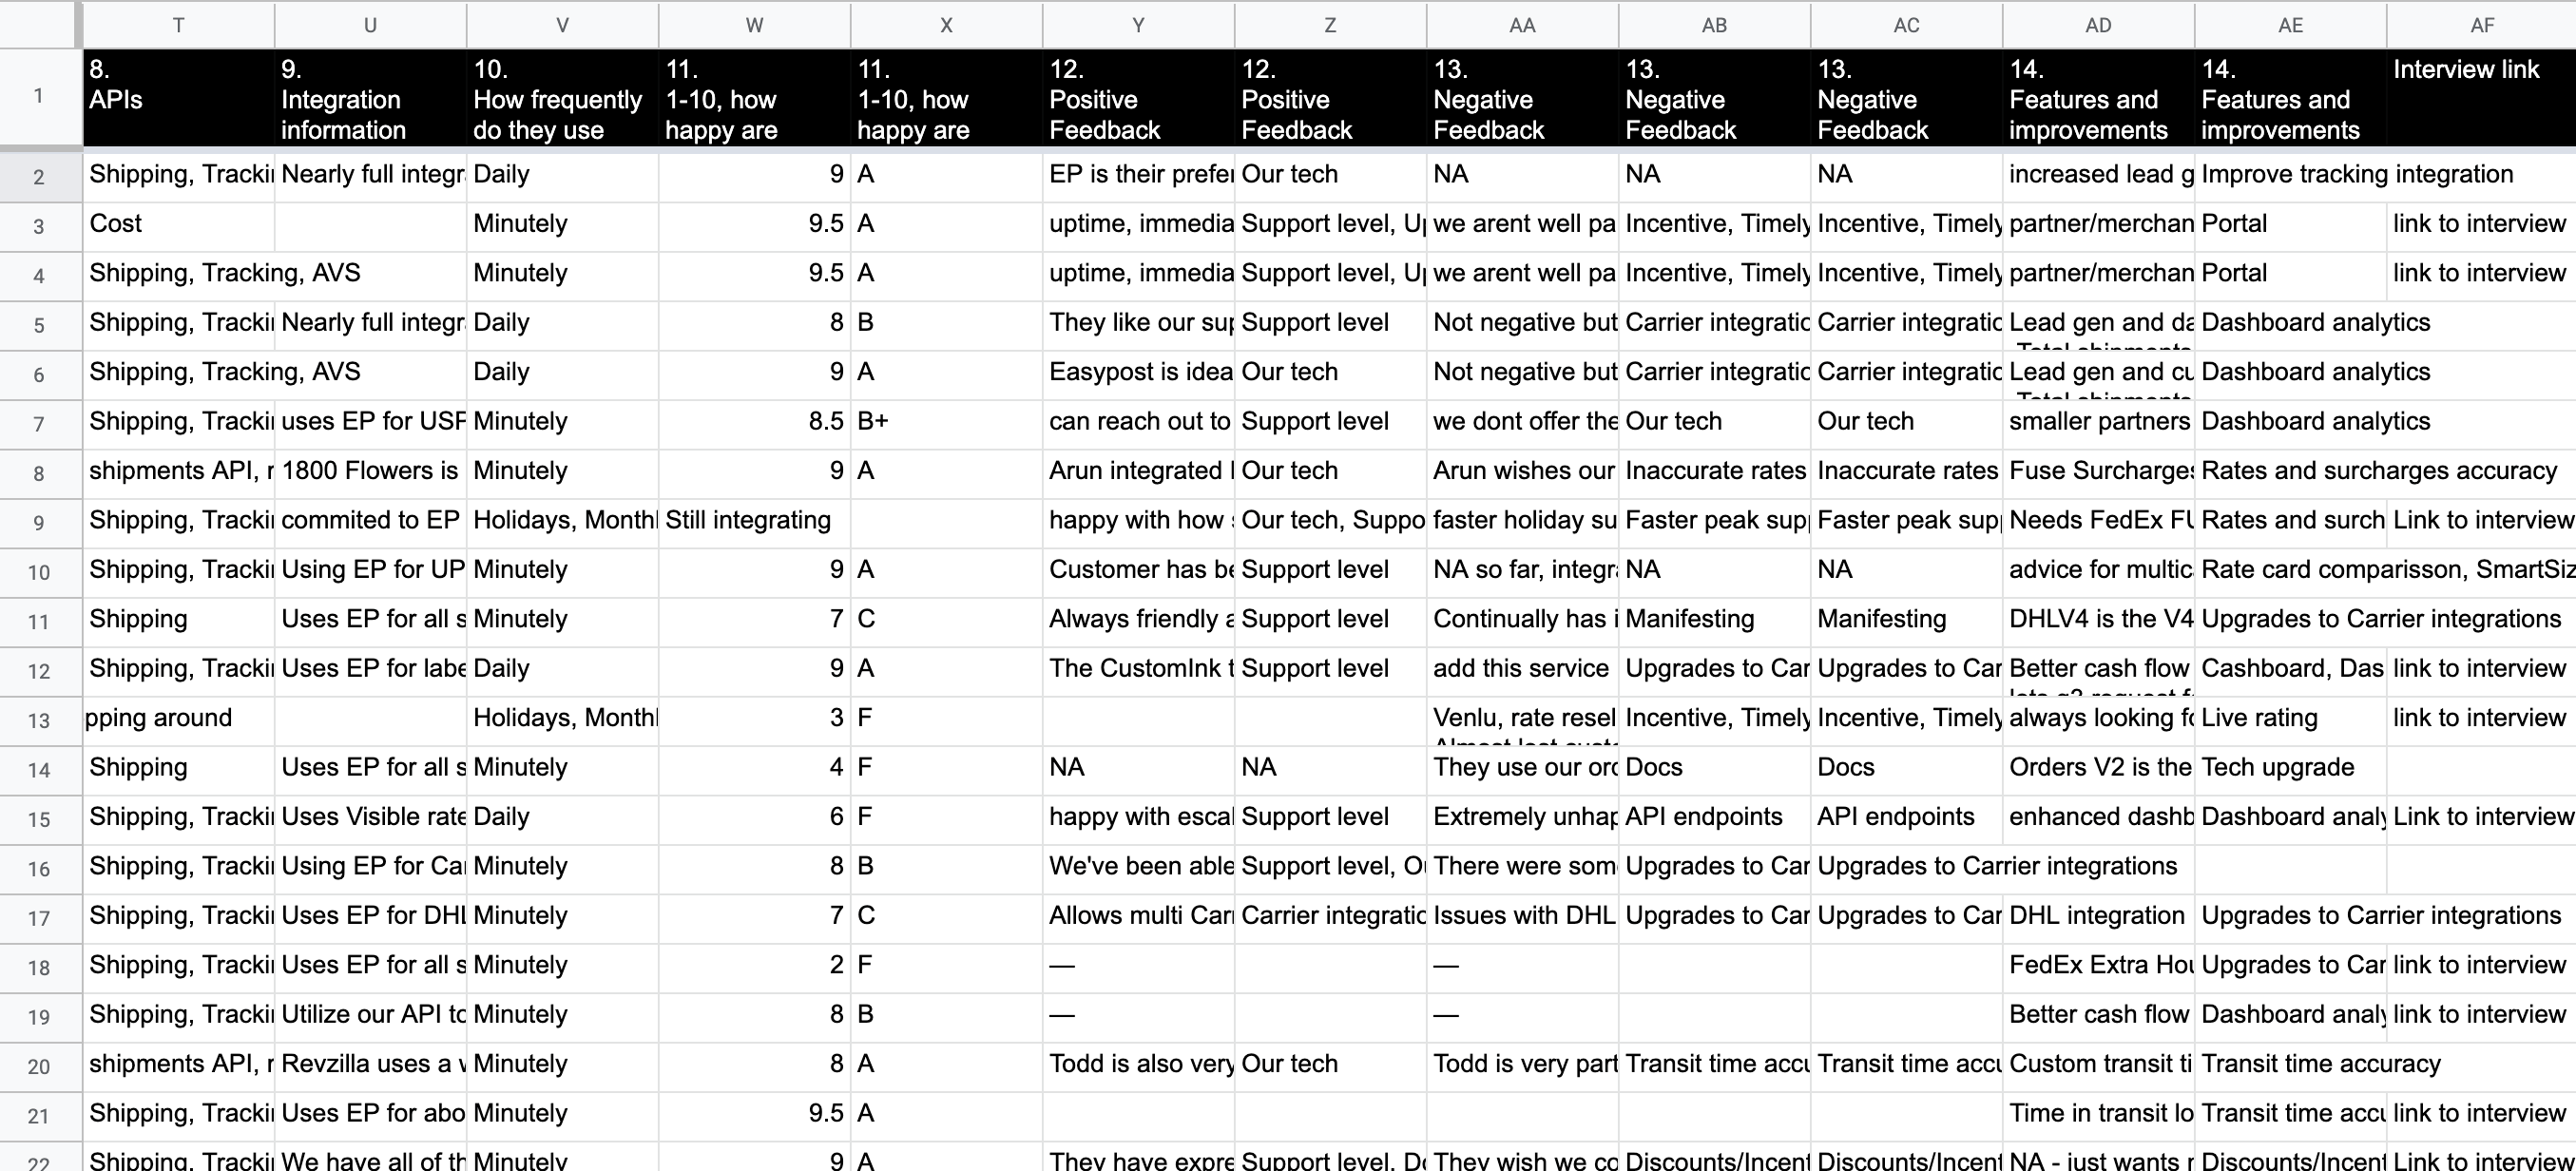
dashboard design + persona validation research journey
Role: Research, design, proof of concept
Team: 1-2 Designers, 3-4 Engineers, 2 PMs + random others
Timeline: 4 quarters
Problem
SMBs and enterprise companies lacked accessible tools to gain actionable insights into shipping operations, leading to inefficiencies, higher costs, and poor decision-making. Without a clear overview of shipments, financials, and performance metrics, businesses struggled to optimize logistics and reduce churn.
Solution
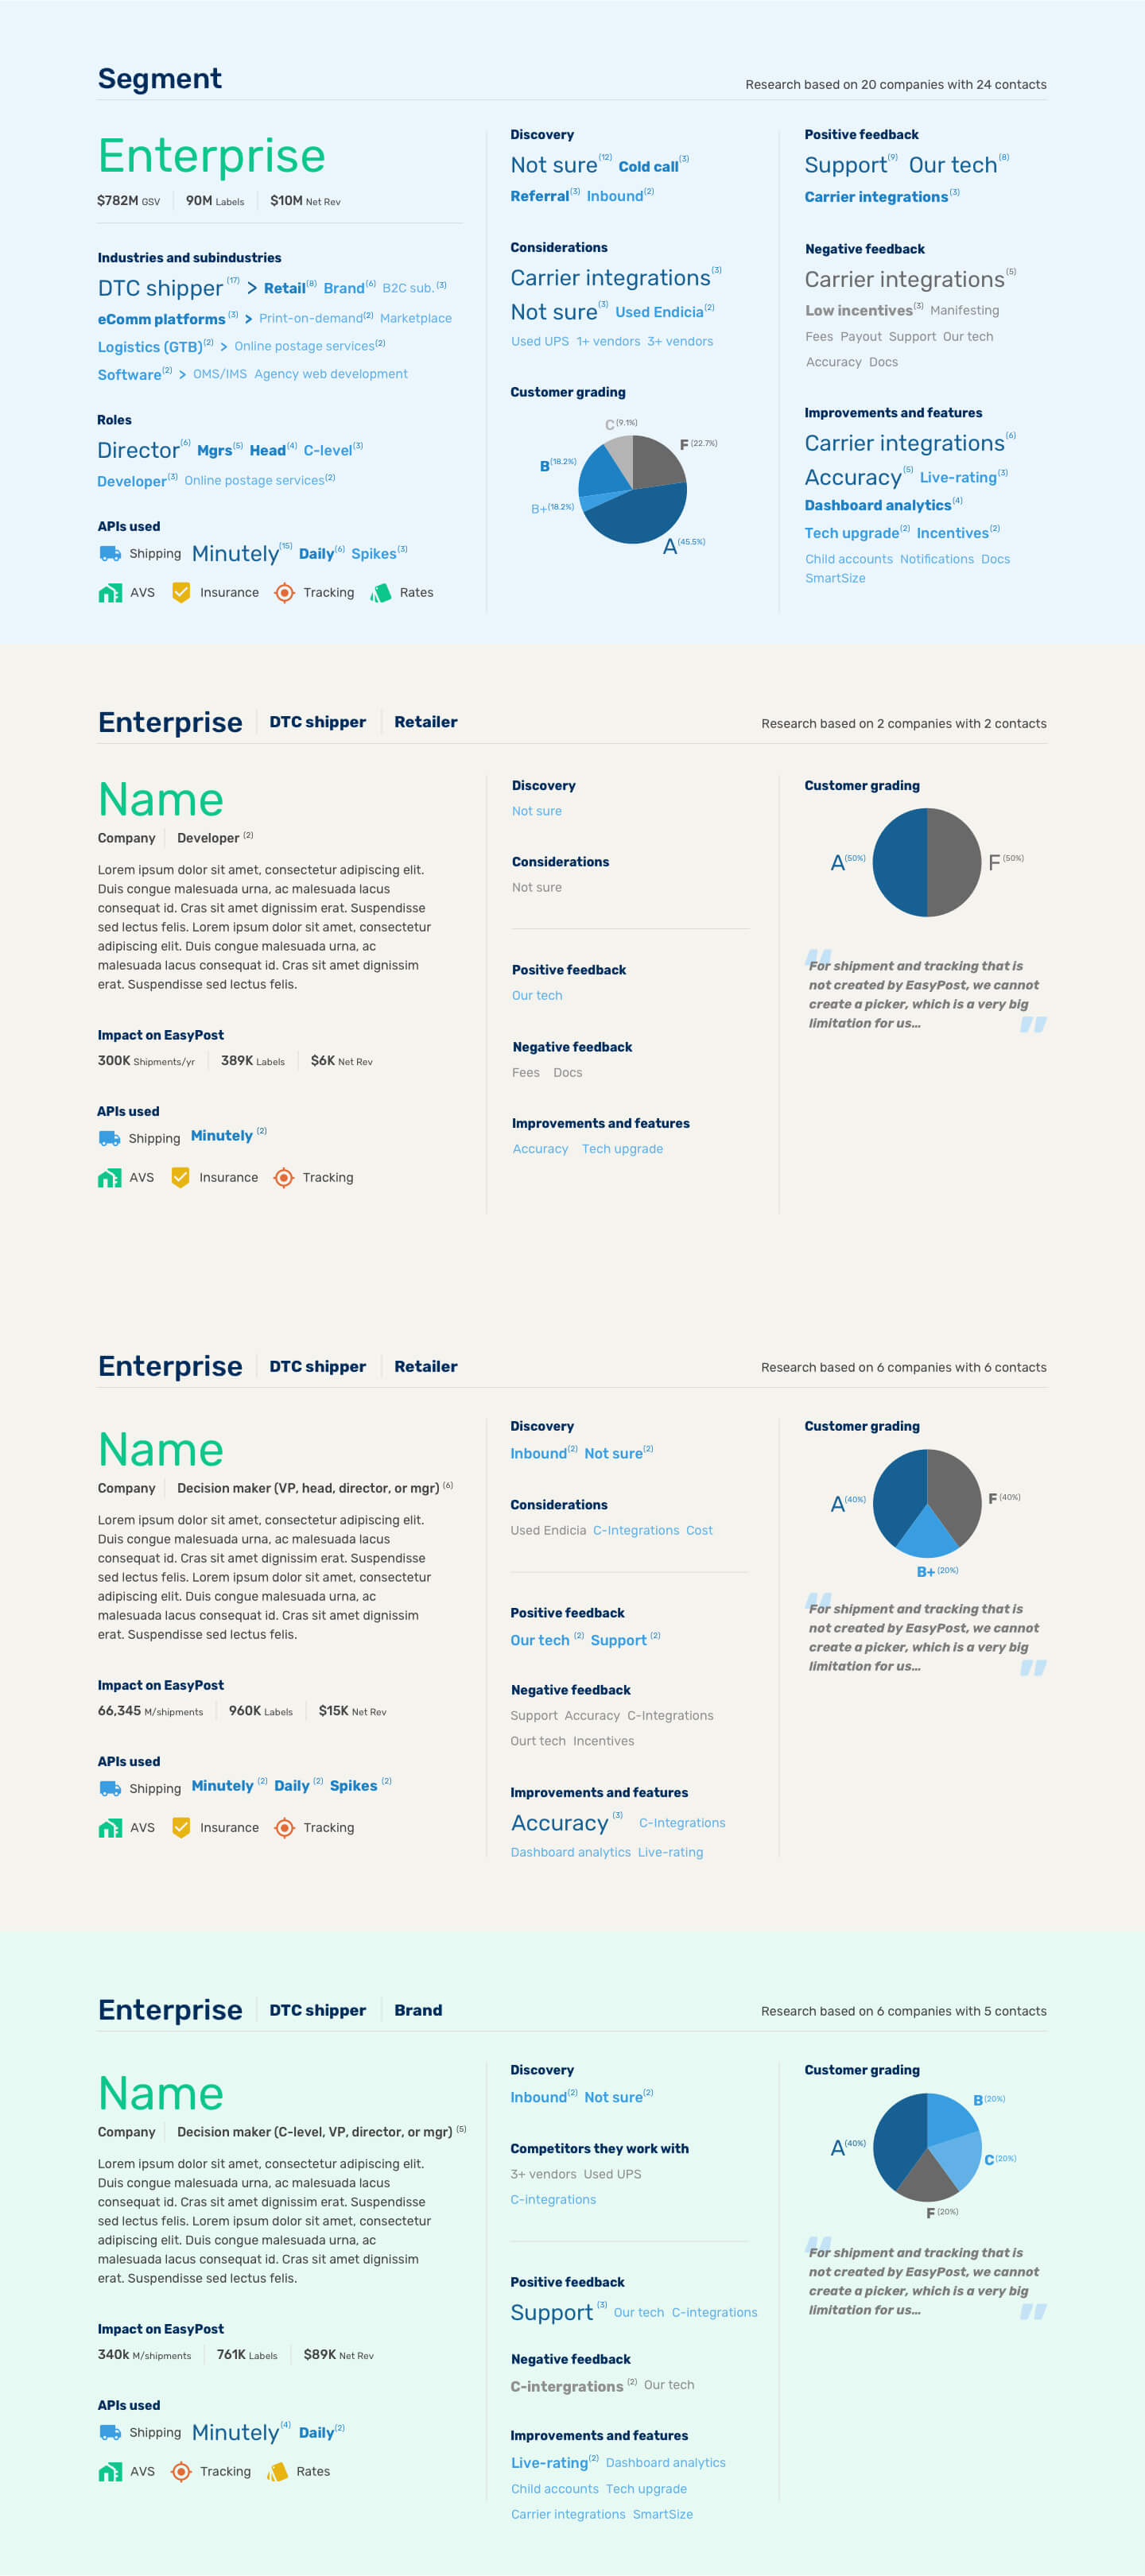
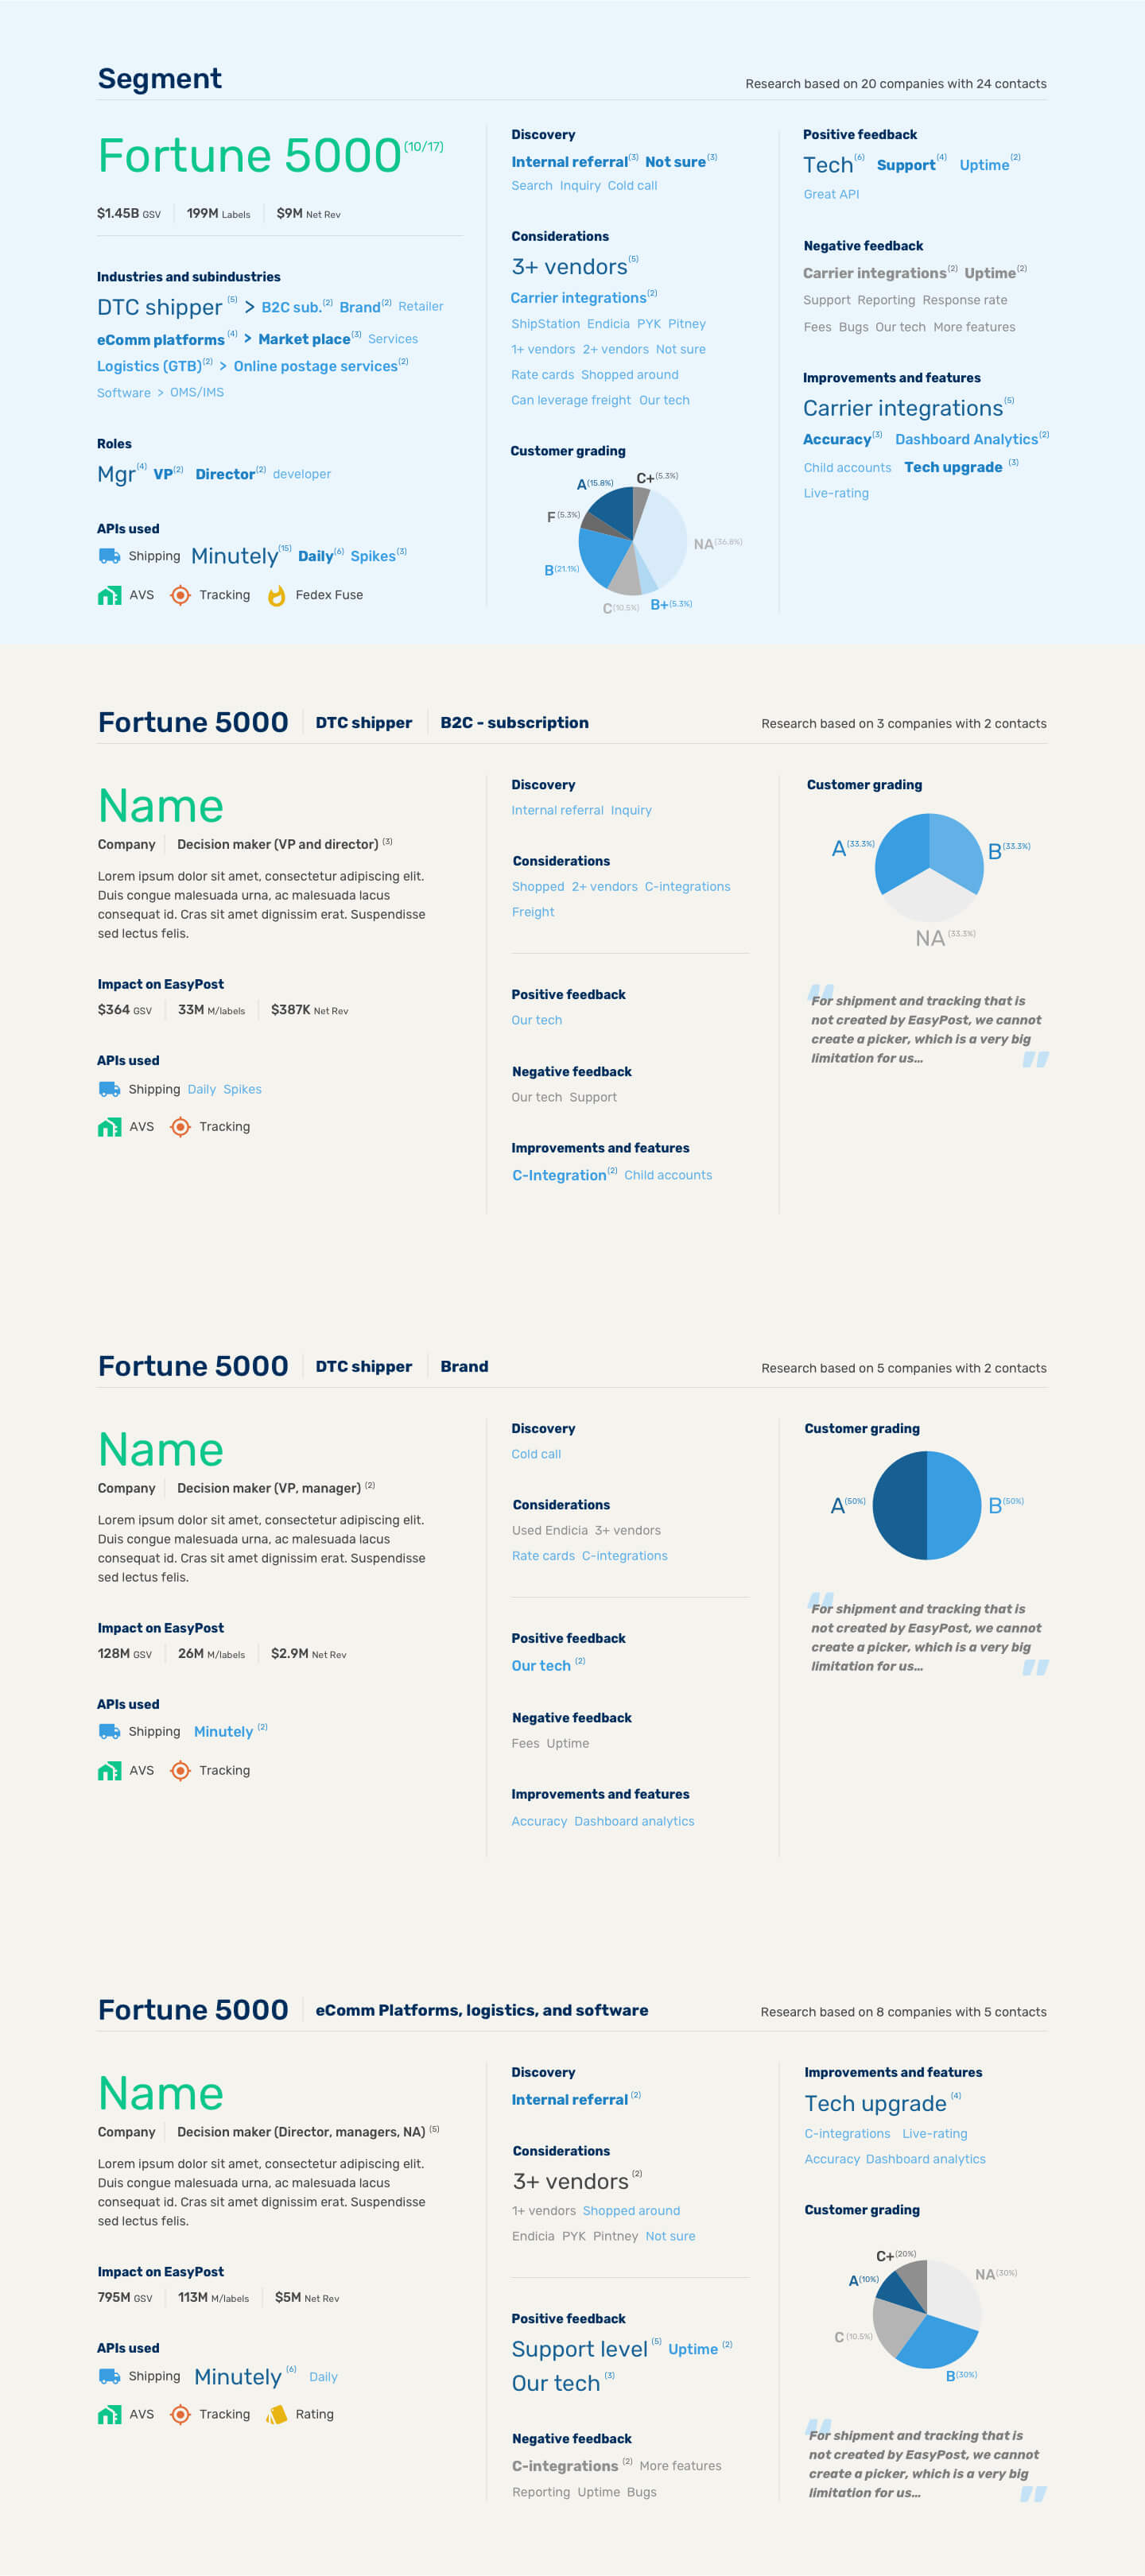
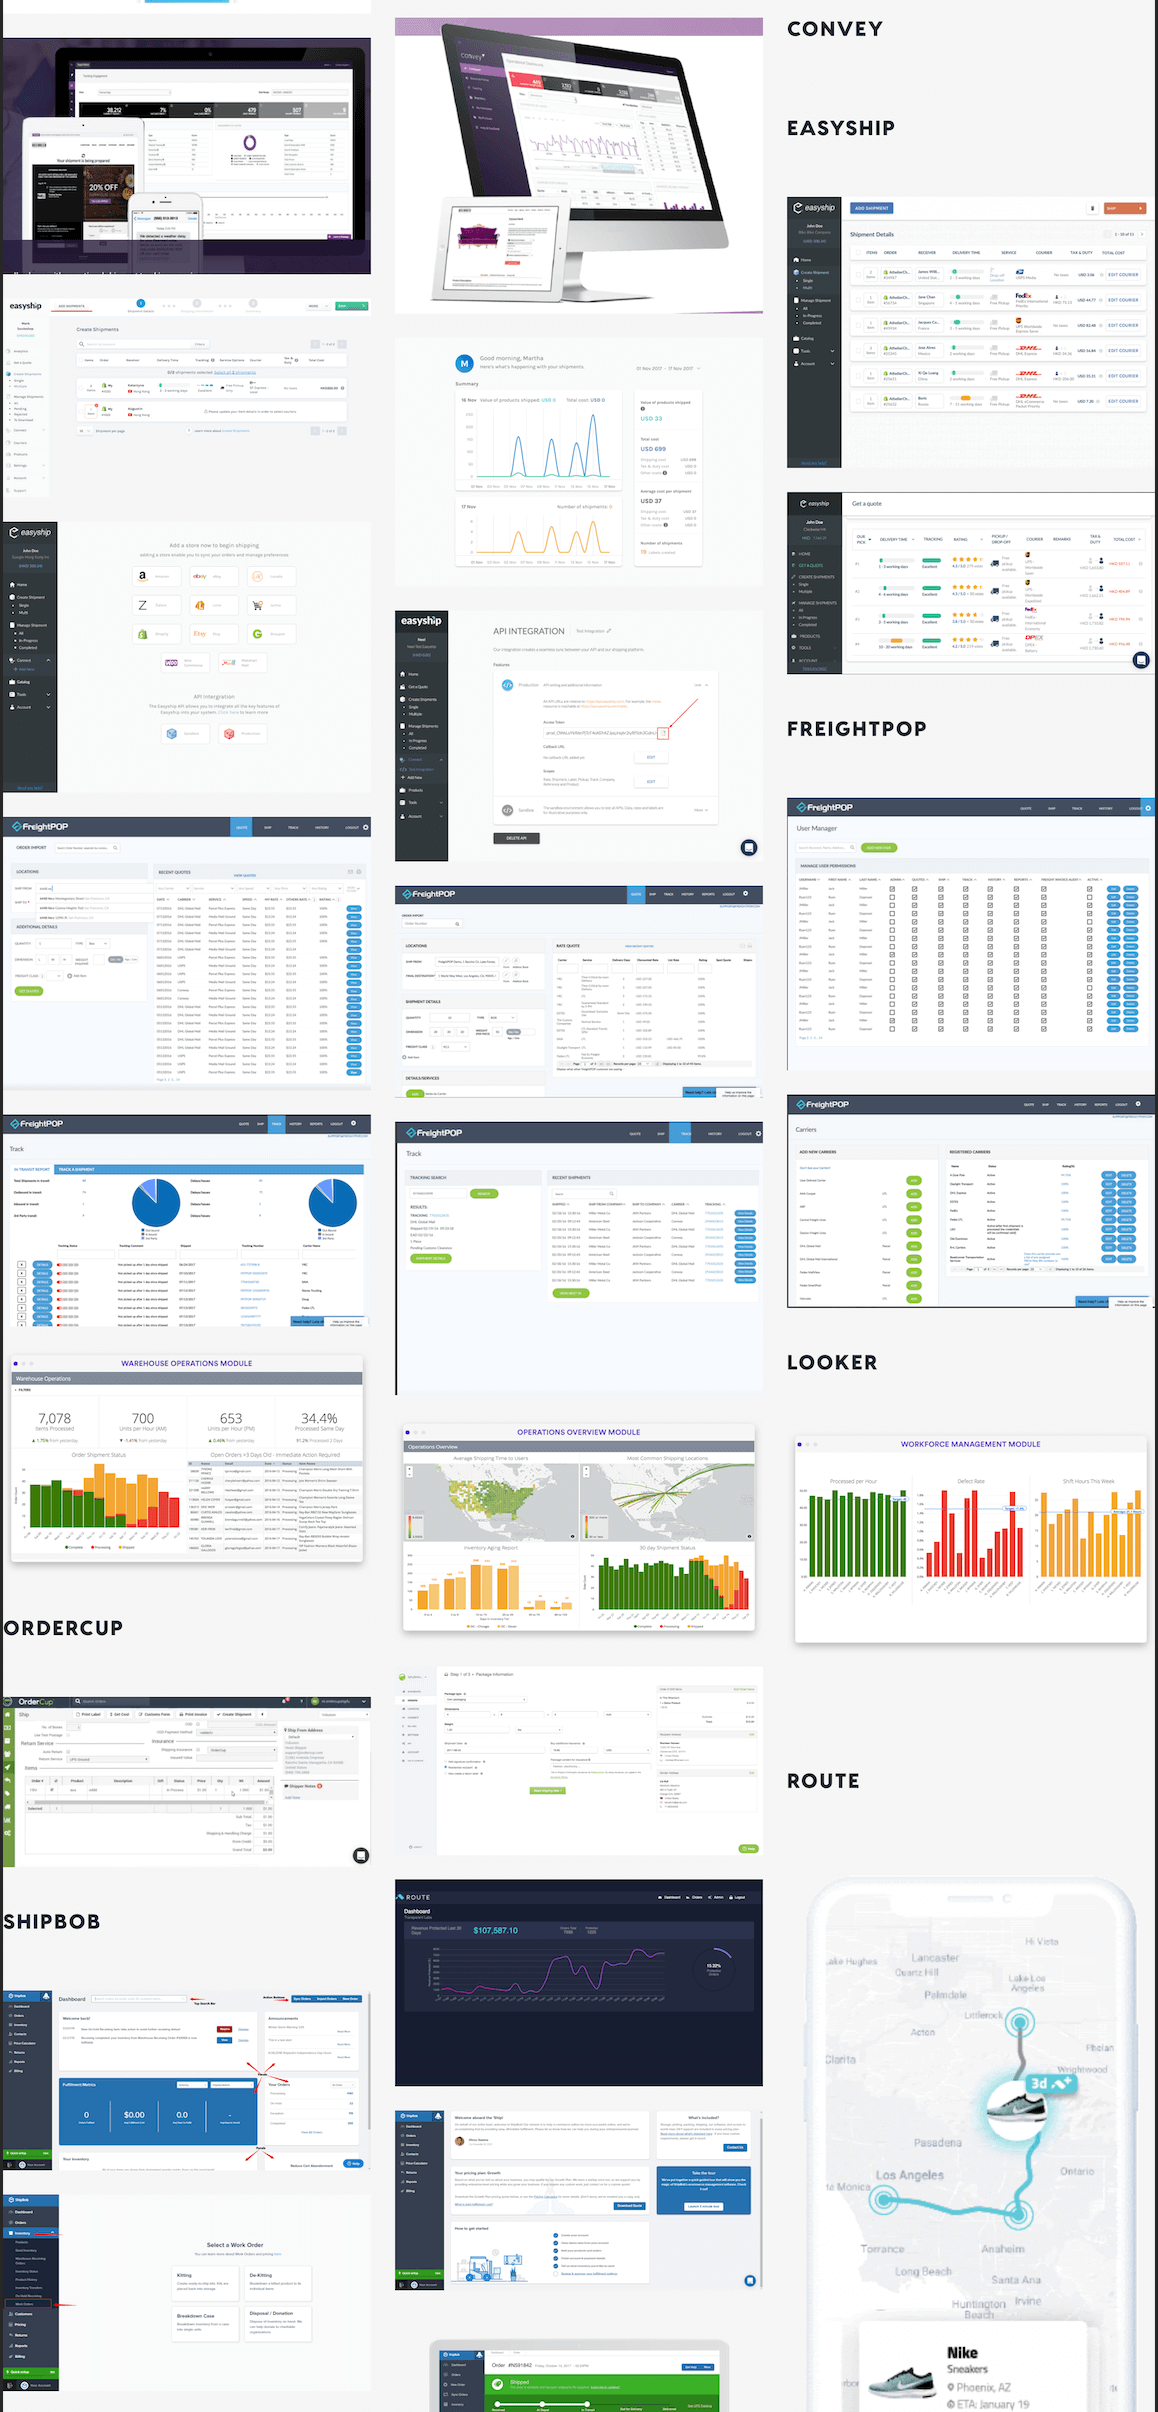
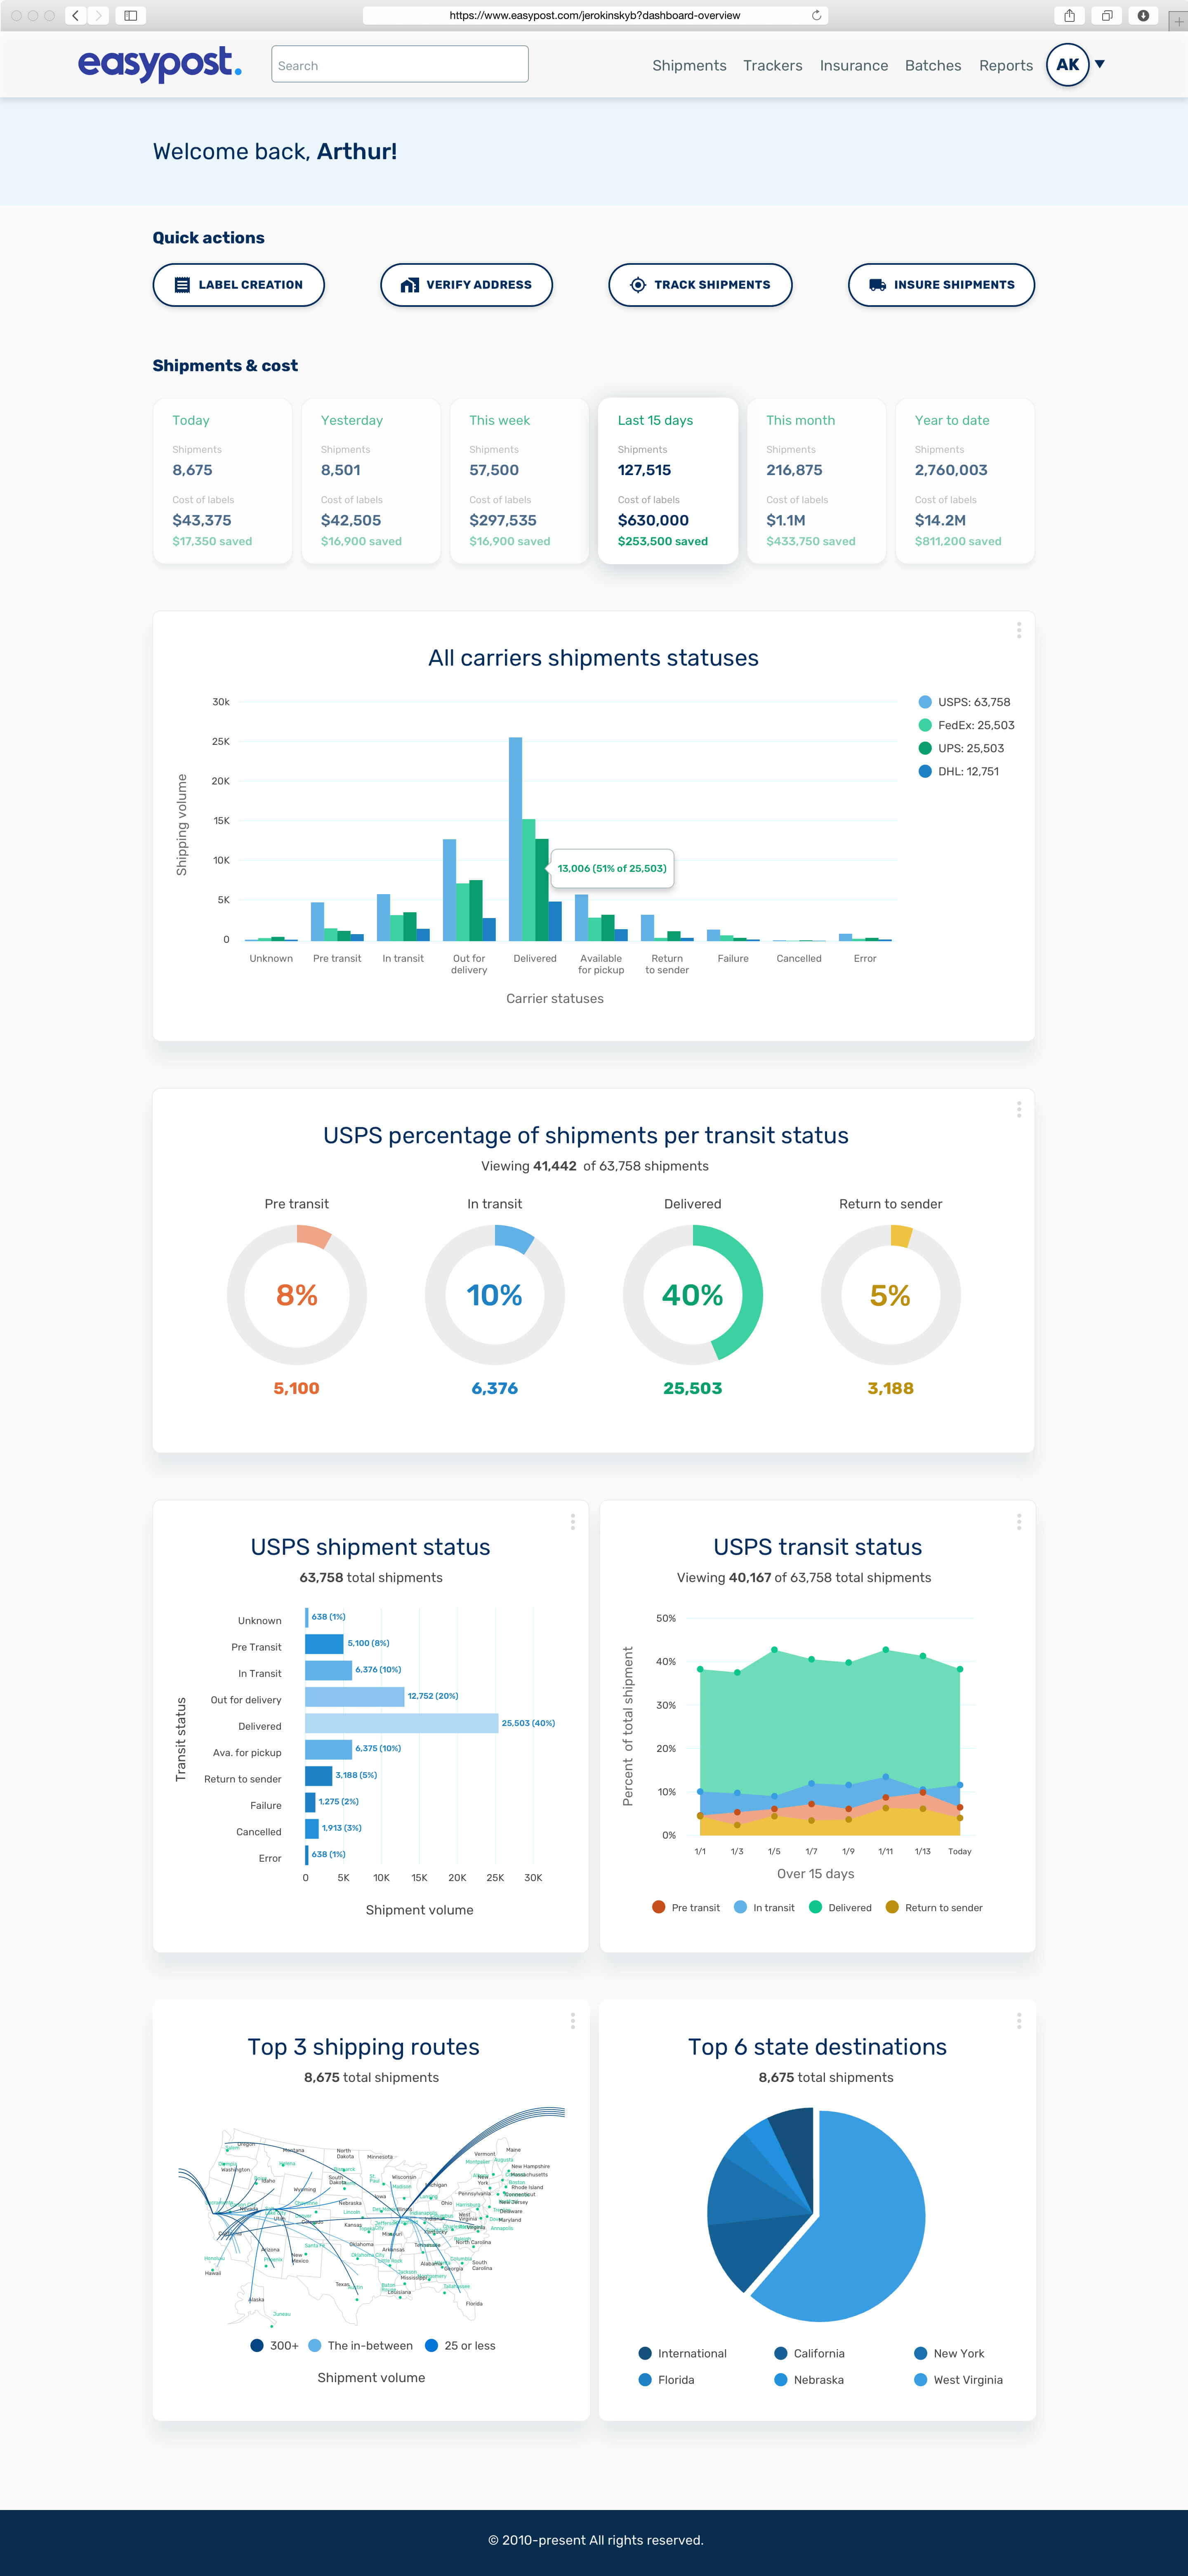
EasyPost developed a visually engaging, scalable dashboard tailored to user needs. The design was rolled out in phases: Phase 1 introduced basic shipment and cost reporting, Phase 2 added geographic insights and transit time analytics, and Phase 3 expanded to cost tracking and shipment statuses. Persona validation research ensured the dashboard met the requirements of business owners, logistics managers, and operations teams, enabling real-time tracking and actionable insights.
Impact
The dashboard empowered businesses with clear, interactive visualizations, optimizing operations and improving decision-making. SMBs and enterprise clients saw improved logistics, reduced costs, and enhanced performance. Its scalability allowed businesses to grow without outgrowing the tool, making it indispensable across a range of shipping operations.
Vision
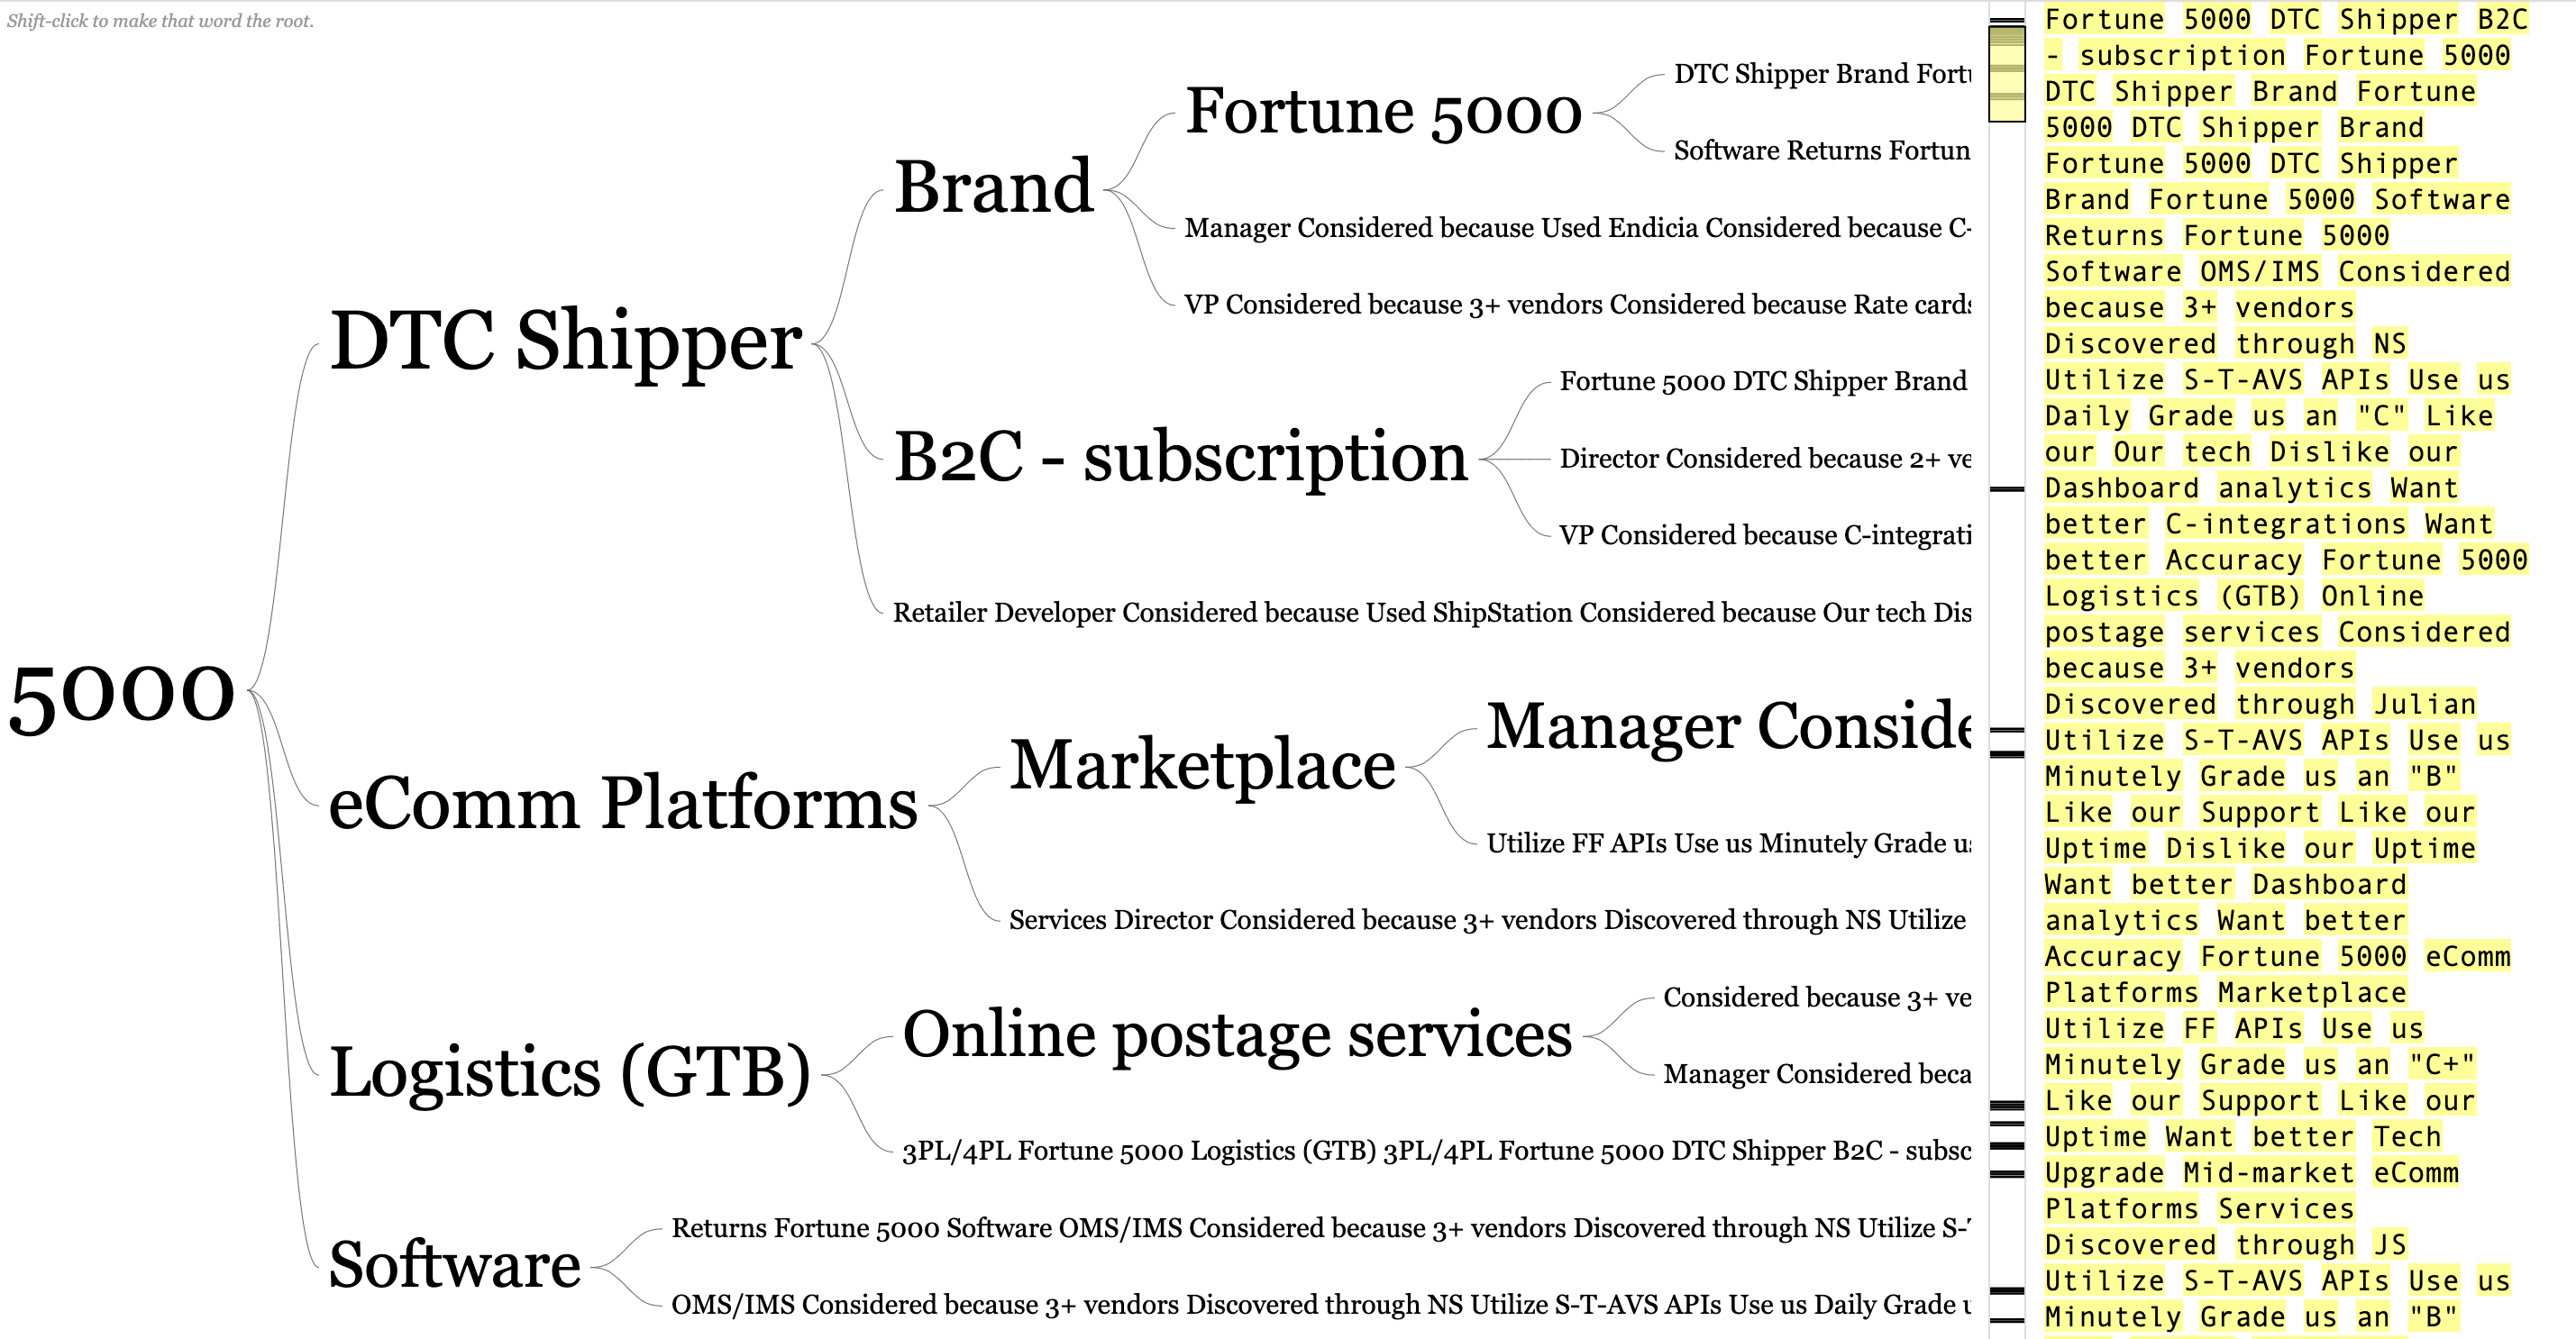
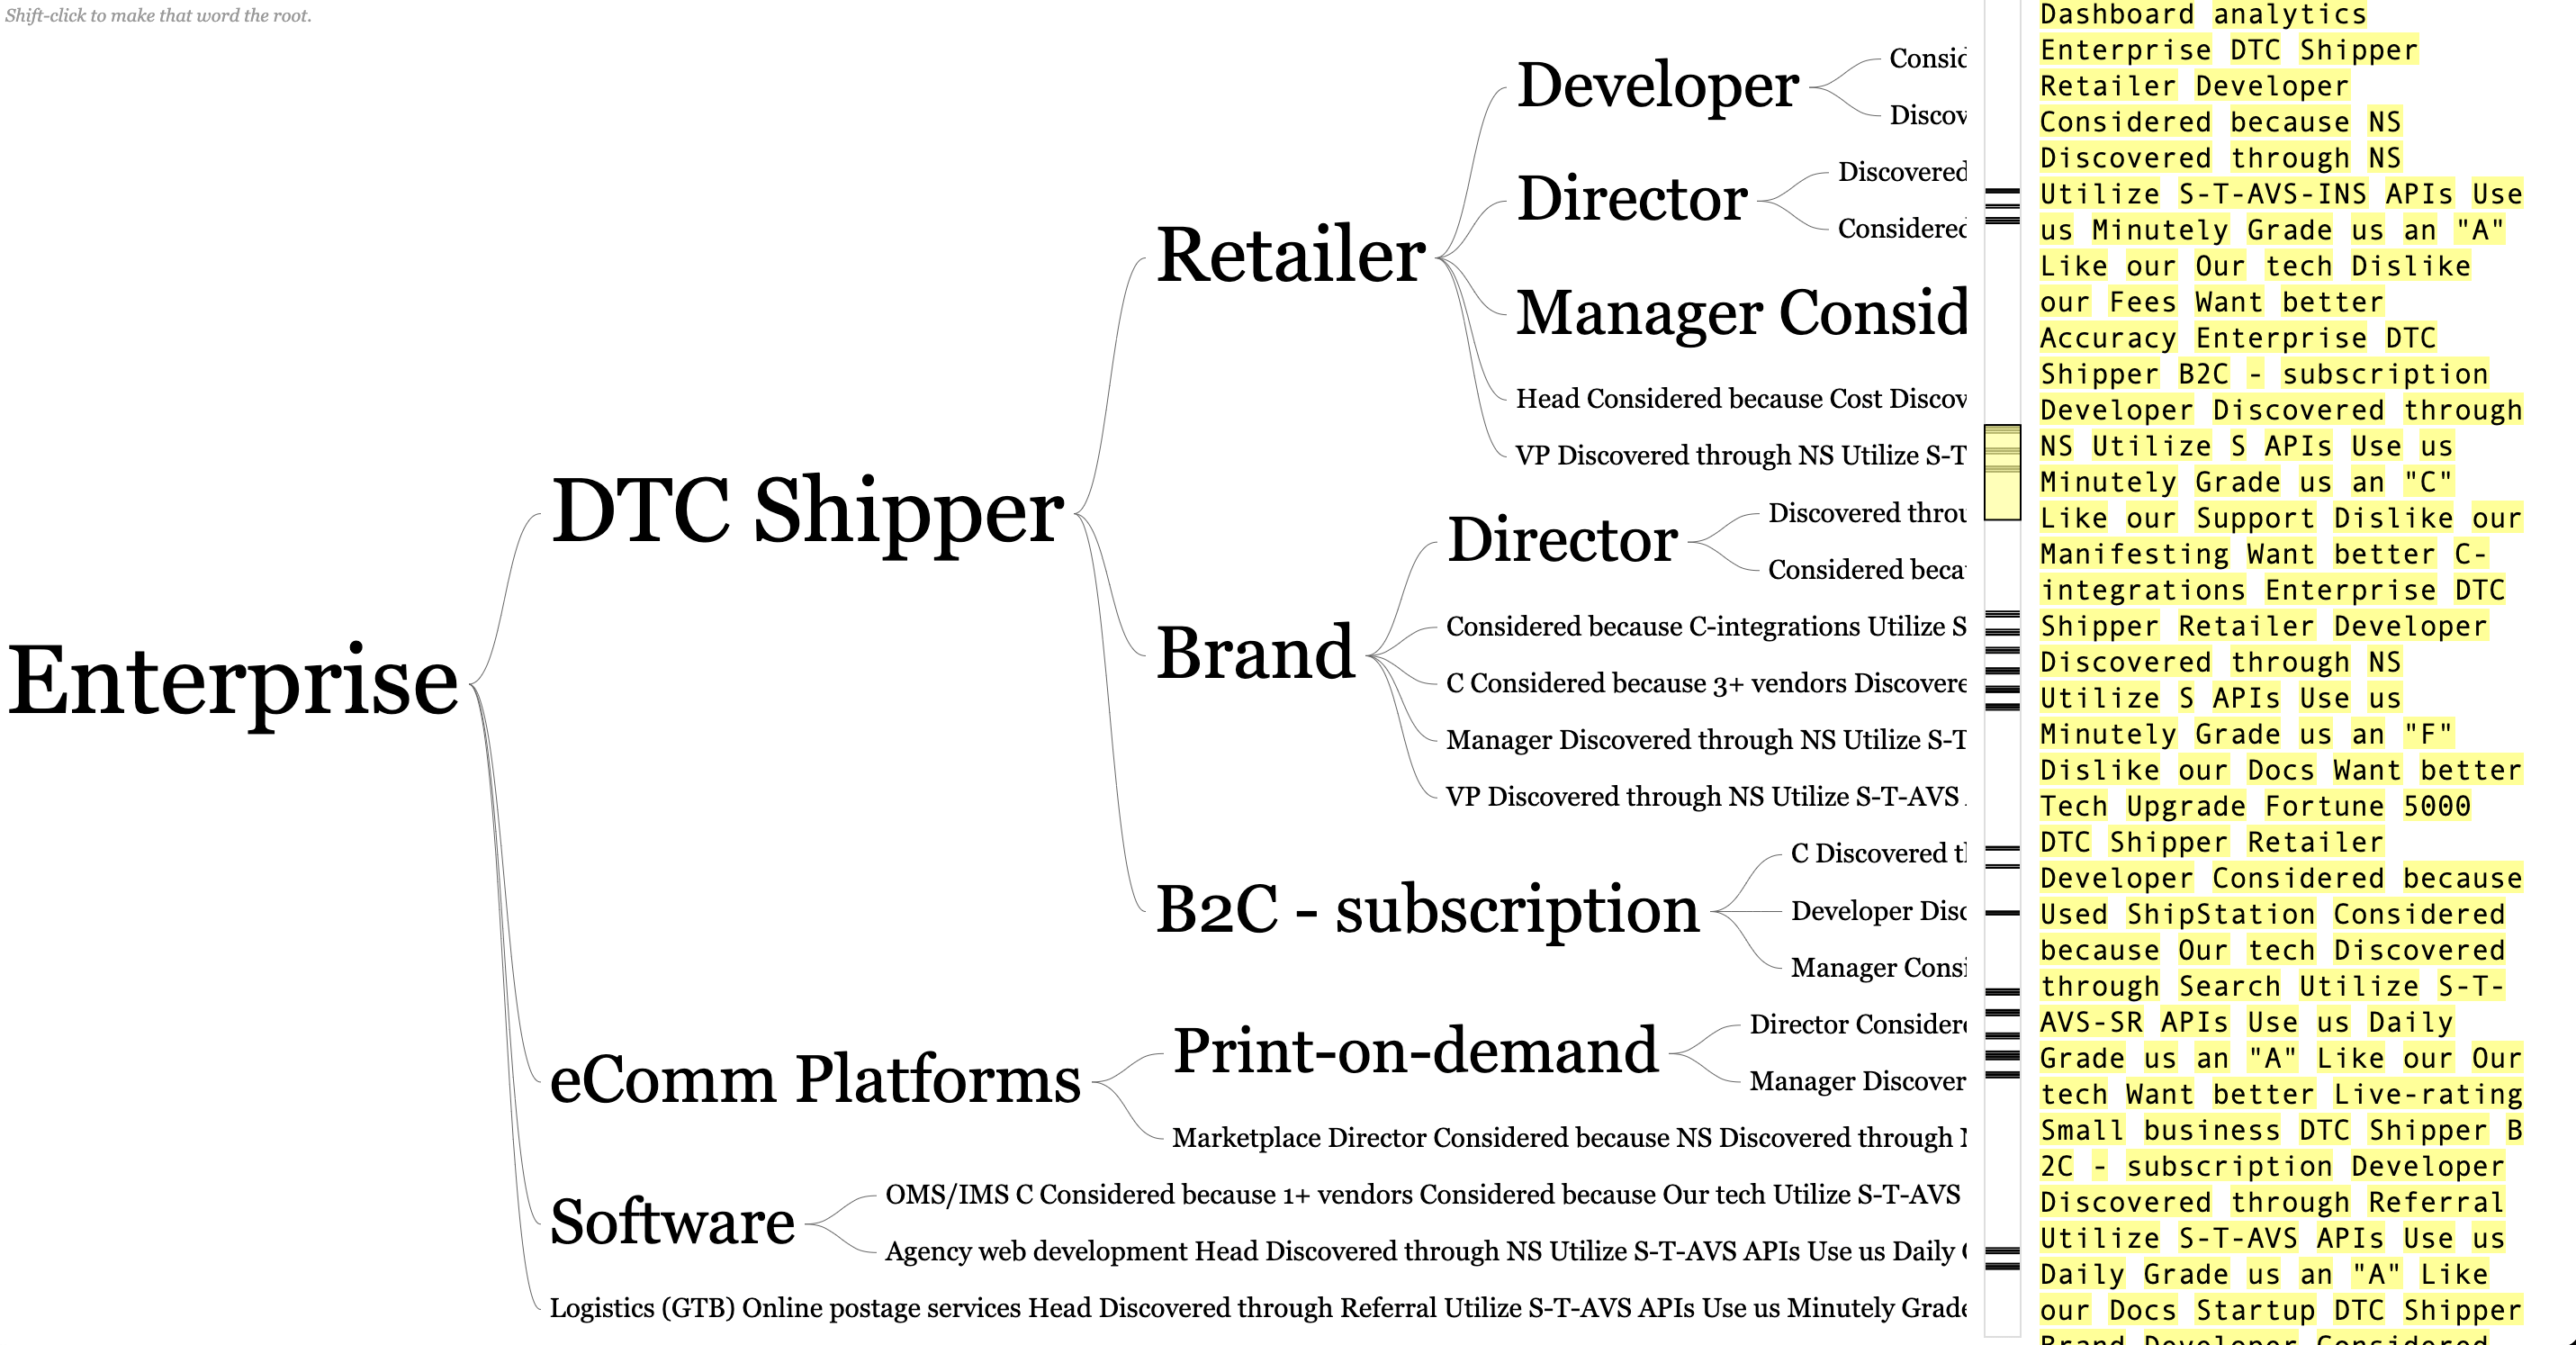
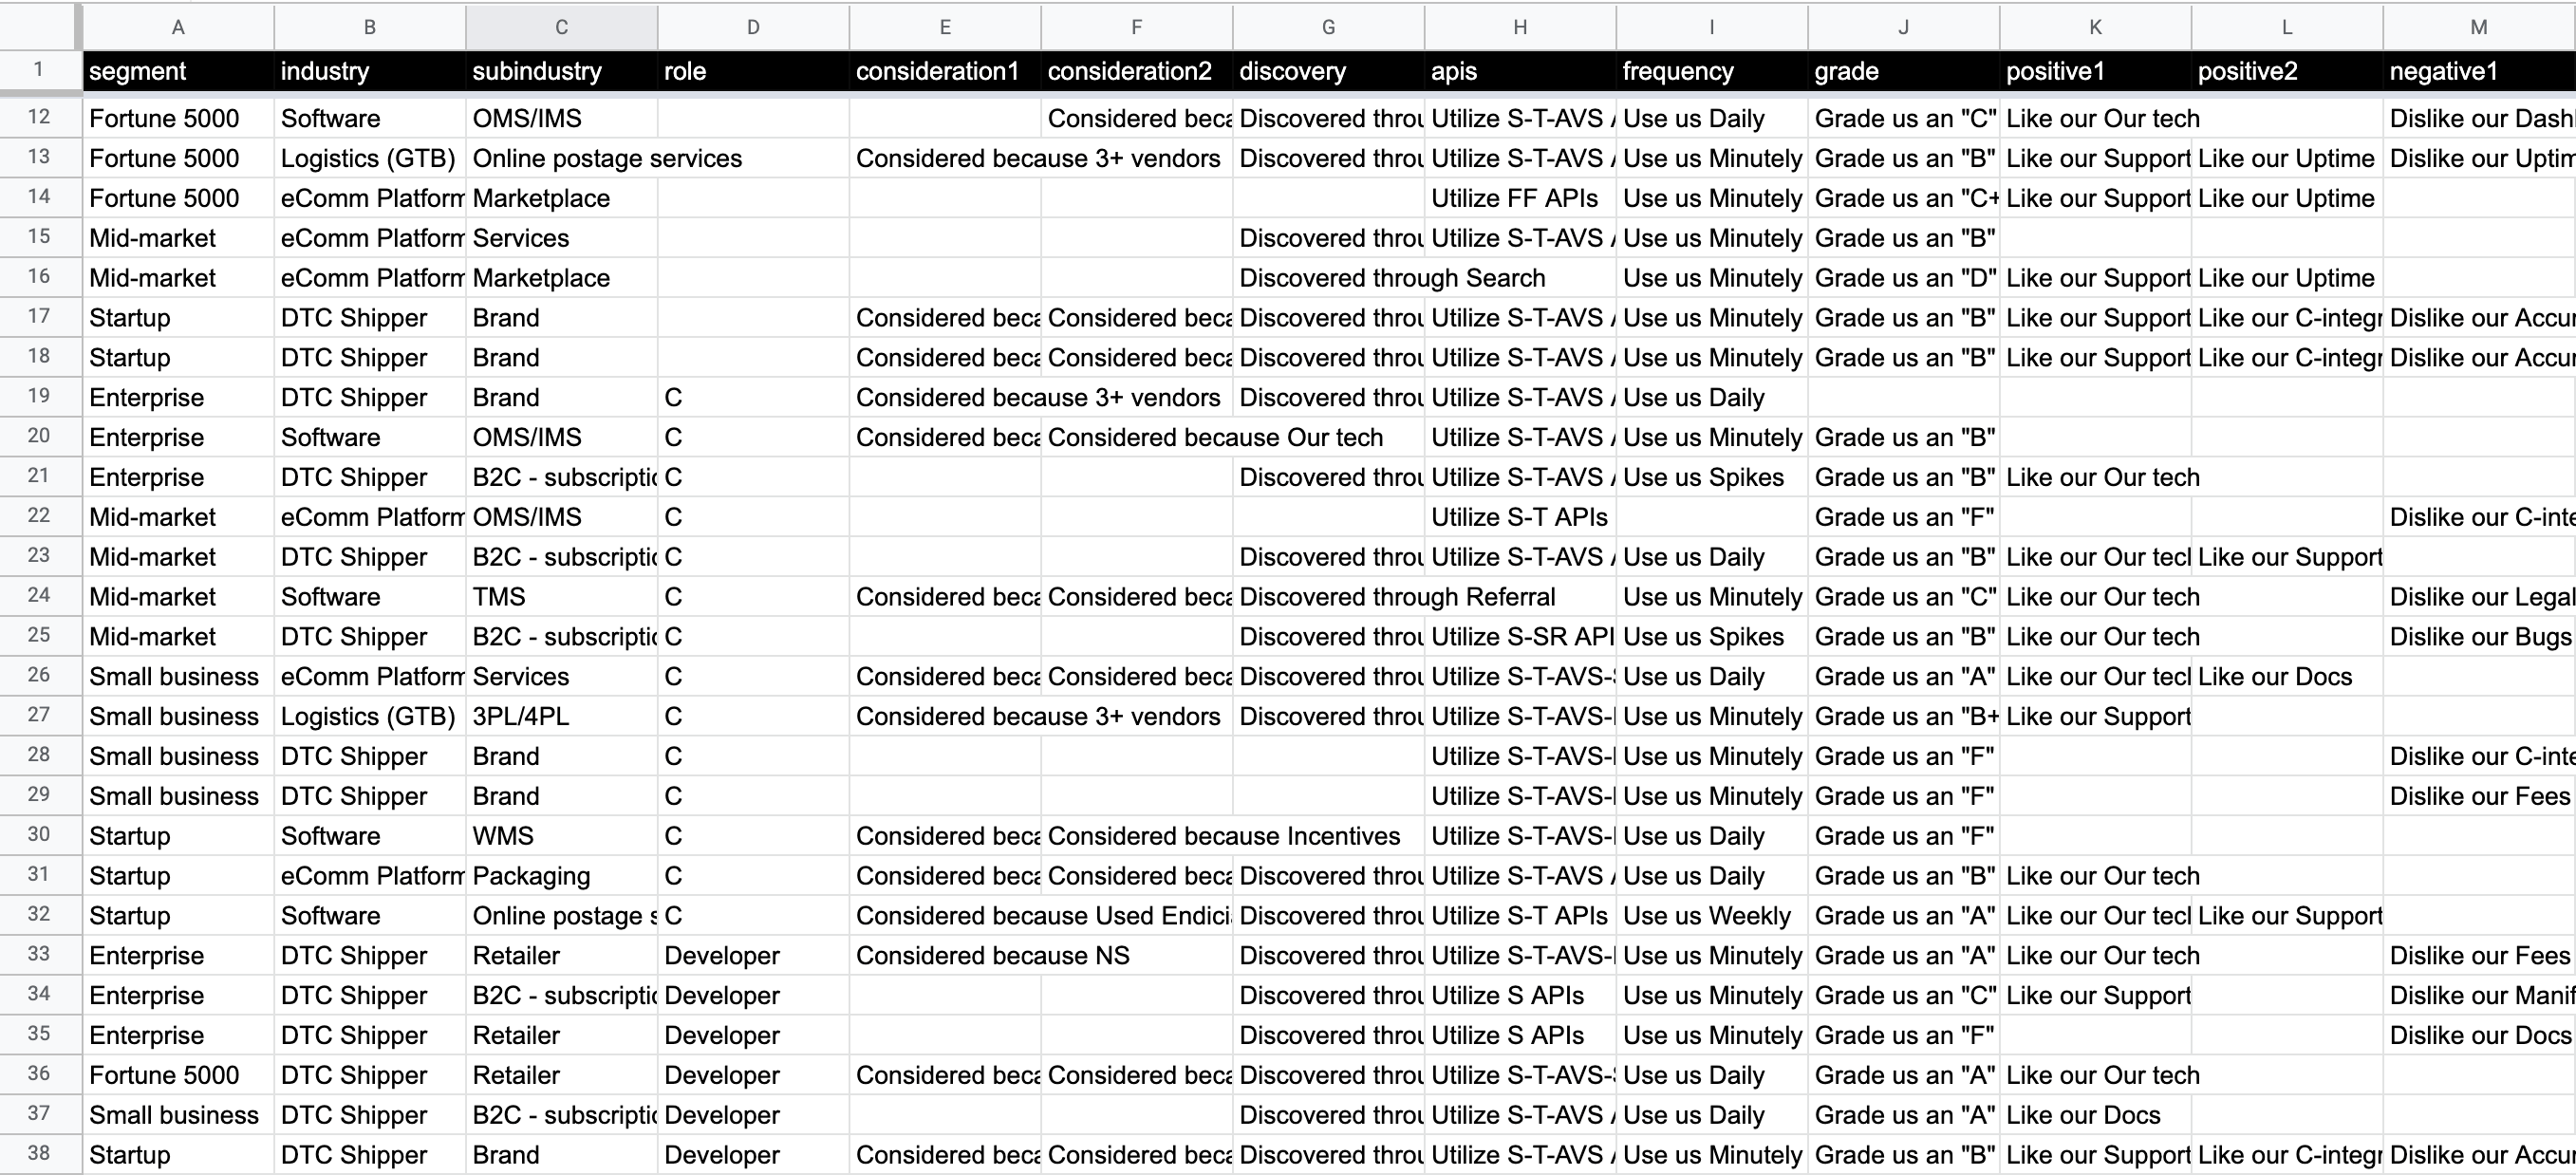
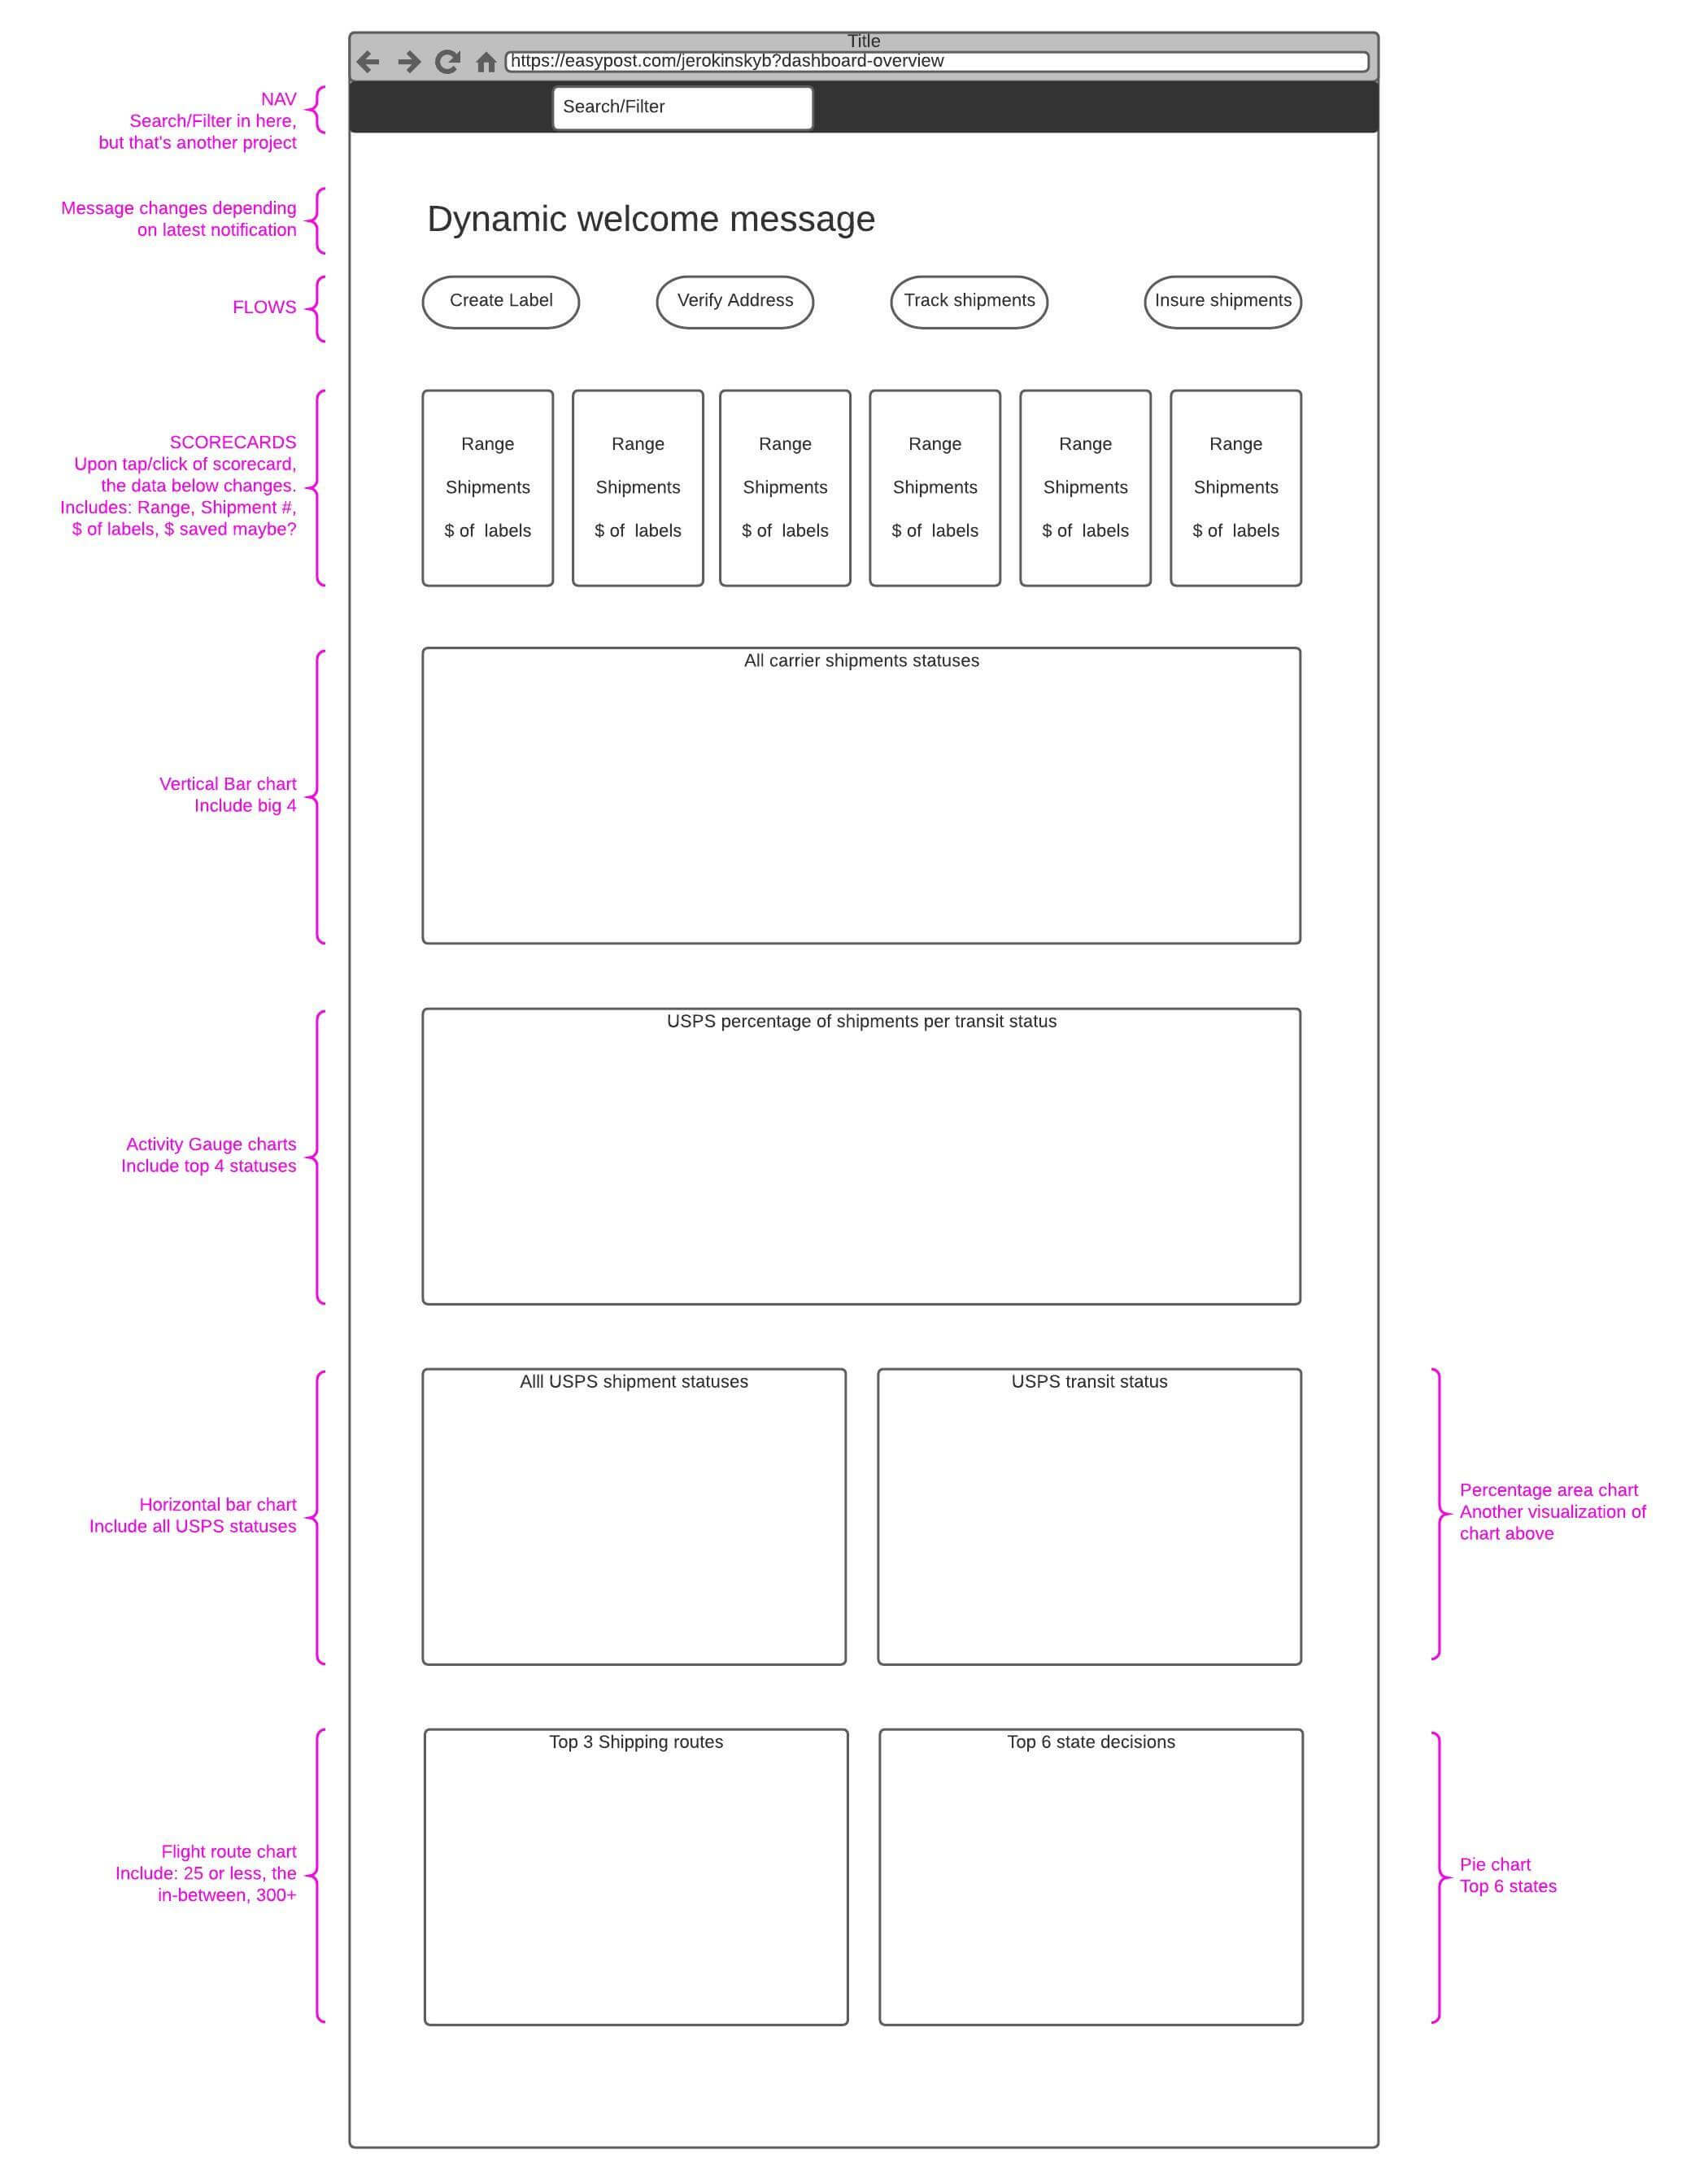
Our goal is to build a visually engaging client-facing dashboard that empowers merchants with insights into their business performance through data visualizations. This dashboard will feature essential reporting for financials, shipments, and tracking, designed to help small and medium-sized businesses (SMBs) manage their shipping needs more effectively. These companies typically lack business intelligence (BI) resources or tools like Looker or Tableau, making EasyPost’s dashboard a vital resource.
Our primary users include business owners, financial officers, logistics managers, transportation directors, and operations managers. While larger organizations often have advanced data pipelines and BI tools, many have indicated they would still reference EasyPost’s dashboard for validation, aligning our tool with their existing systems to maintain consistency and accuracy in shipping metrics.
Values
The dashboard will feature simple, interactive visual reports that not only provide a snapshot of current data but also empower merchants to leverage EasyPost’s services effectively. By making our data visual, intuitive, and actionable, merchants can easily champion their brand and optimize operations, tracking metrics in real-time to identify trends, make business decisions, and improve their logistics.
Methods
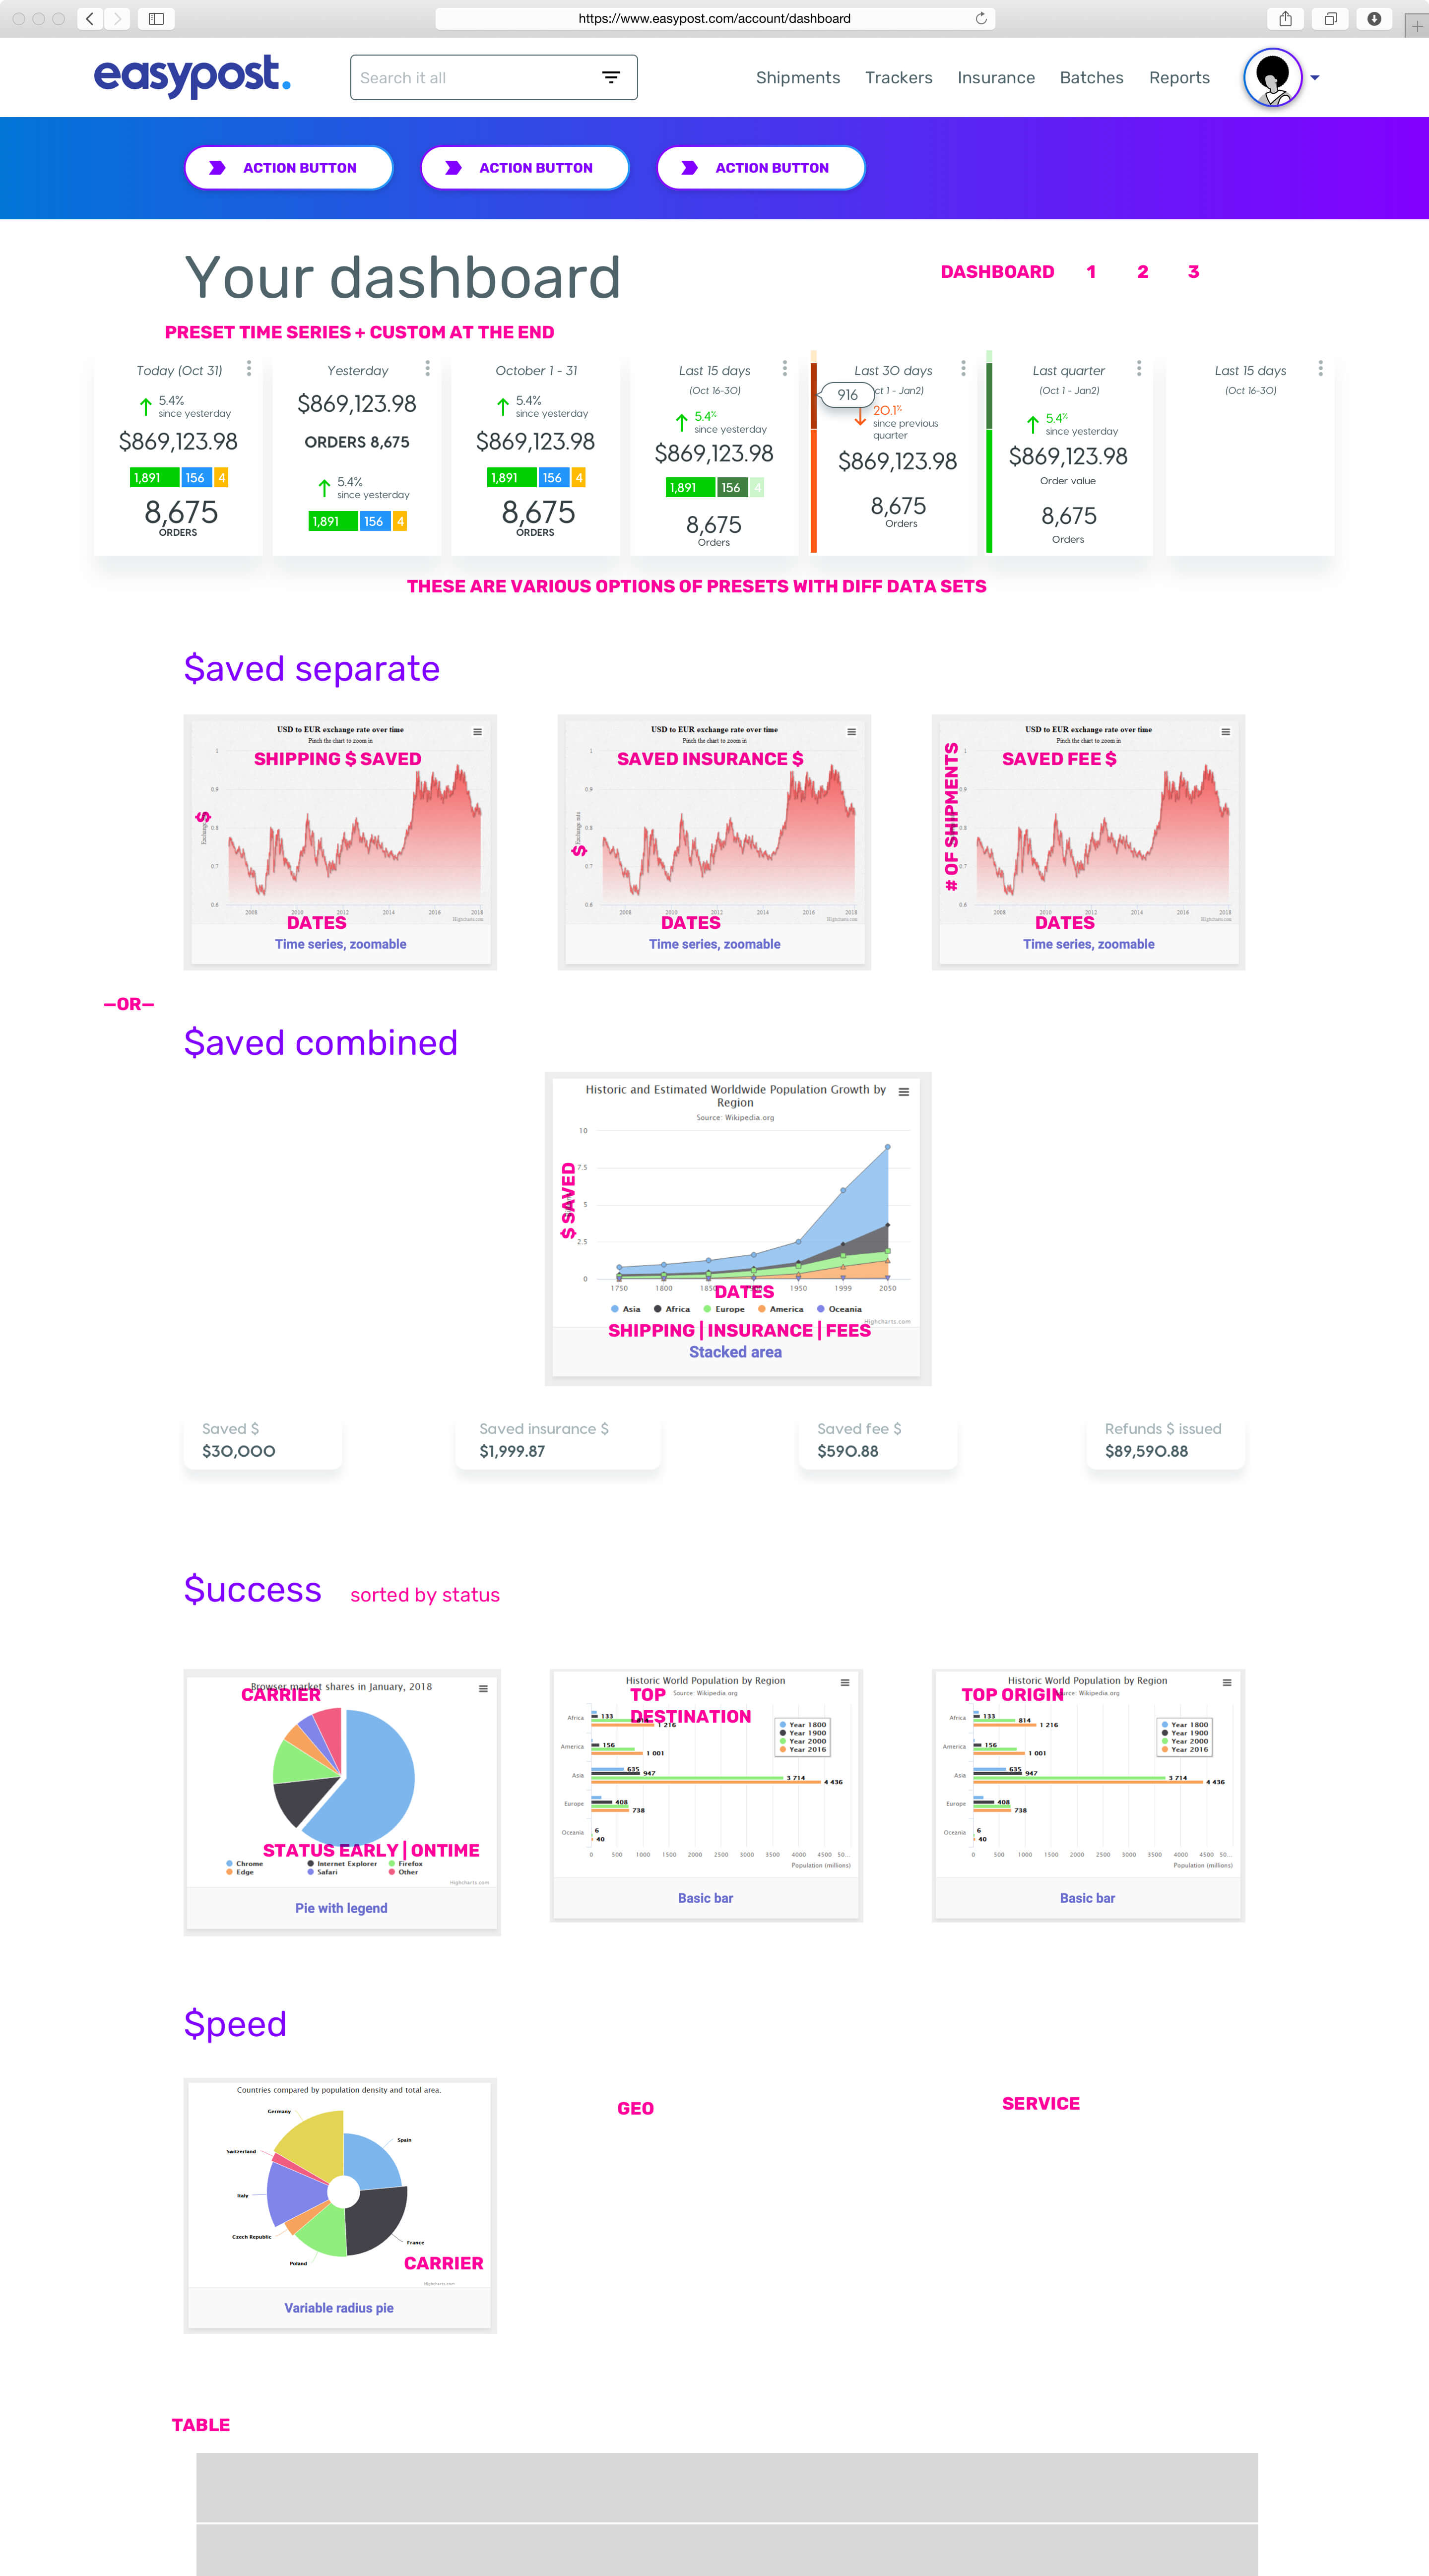
Our product team aims to develop this tool incrementally, delivering granular insights refreshed hourly to meet short-term data needs, with long-term goals of providing near real-time (live) data updates. We’ll incorporate trend analysis over customizable time frames, including day-over-day, week-over-week, month-over-month, and year-over-year comparisons.
The timeline for each phase will evolve based on developer estimates for data retrieval and rendering across these various time scales, allowing for flexibility in response to resource availability.
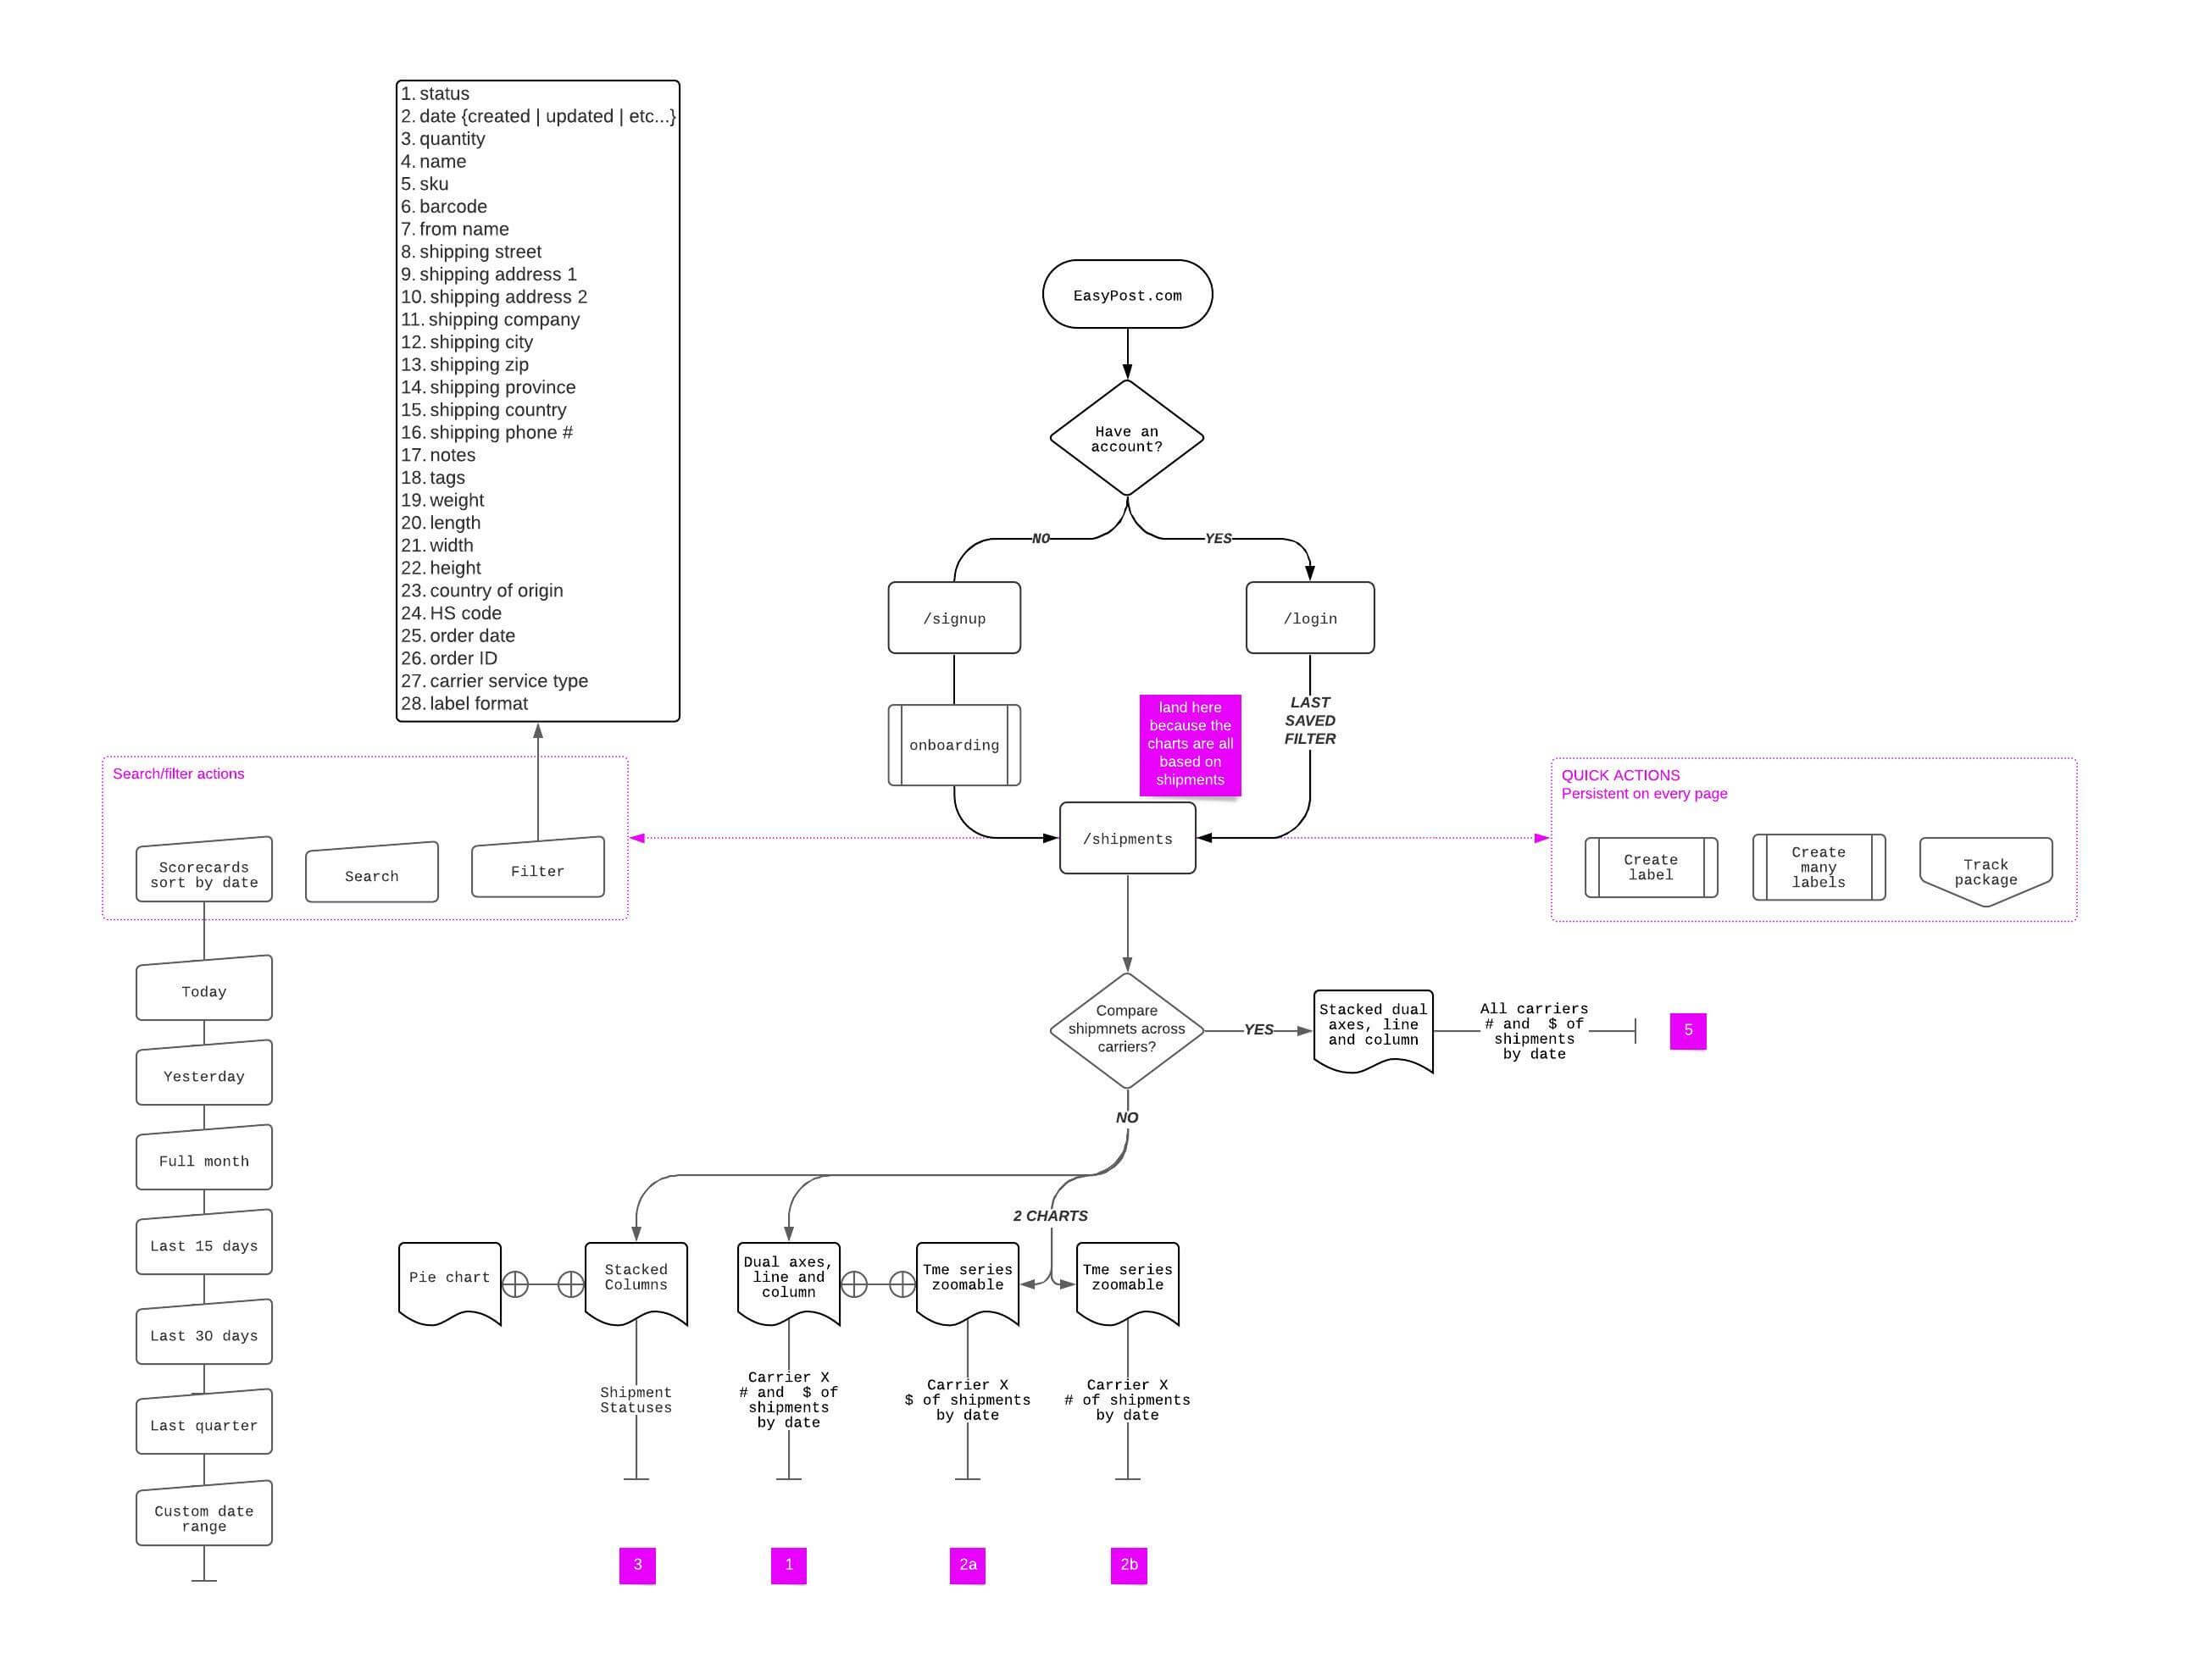
Phase 1: Initial Shipment and Cost Reporting
- Metrics Displayed:
- Number of shipments over time, segmented by carrier.
- Cost of shipments over time, segmented by carrier.
- Use Cases:
- As a business owner, I want to compare my shipment volume daily, weekly, or monthly across carriers to better understand my business’s shipping metrics.
- As a financial executive, I want visibility into my spending with EasyPost across carriers to monitor cash flow and manage expenses.
Phase 2: Advanced Geographic and Transit Insights
- Metrics Displayed:
- Heat map to show shipment destinations.
- Transit times segmented by carrier, service, and geography (e.g., country or U.S. states).
- Use Cases:
- As a logistics director, I want to visualize shipment destinations to make informed decisions about distribution, carrier selection, and potential new warehouse locations.
- As a VP of customer success, I want insight into transit times to tailor customer messaging on expected delivery schedules.
- As a transportation director, I want transit times broken down by carrier and service to improve carrier selection and delivery efficiency.
Phase 3: Comprehensive Cost and Status Tracking
- Metrics Displayed:
- Refunded shipments metrics added to existing shipment and cost reports.
- Shipment statuses (e.g., delivered, in transit, pending).
- Spending breakdown, including labels, address verifications, insurance, and other charges/credits.
- Use Cases:
- As a financial executive, I want to understand the value of refunded shipments for accurate cash flow forecasting.
- As a customer success VP, I want to view delivery statuses to set customer expectations and guide support staff accordingly.
- As a financial executive, I need a breakdown of EasyPost charges for tracking expenses and monitoring cash flow.
Phase 4 and Beyond: Granular Cost and Performance Insights
- Metrics Displayed:
- Detailed cost analysis (shipping vs. insurance vs. small fees).
- Breakdown by child accounts and geography.
- Additional transit metrics, including on-time delivery rates.
- Use Cases:
- As a financial executive, I need detailed breakdowns of fees to evaluate cash flow and optimize costs.
- As a transportation director, I want to monitor carrier performance for on-time delivery to inform contract discussions and carrier selection.
Obstacles
- User Perspective: Current CSV reports require additional processing, creating a burden for SMB users without dedicated data analysts. Merchants want quick, visual insights to easily assess expenses, carrier usage, and delivery metrics.
- Sales Perspective: Competitors already offer visual dashboards, making our enhancement essential for retaining and attracting customers.
- Engineering Perspective: Developing a data warehouse solution will prevent excessive API load from dashboard queries, ensuring scalability and reducing latency in data retrieval.
Measures
- Engagement: Increase in daily dashboard logins/views by 15%.
- User Retention: Increase in time spent on the dashboard by 50%.
- NPS: Increase customer NPS by 15 points with enhanced data accessibility and visualization.
- Churn Reduction: Reduce churn attributed to lack of visual reporting by 50%, improving our competitive standing and customer loyalty.
By progressively developing this dashboard, EasyPost will empower users across business functions with actionable insights, support decision-making, and enhance user satisfaction, setting a new standard in shipping data visualization.